hi there 👋
I hope everything is well.
Today, let’s look at morning and night HRV data, through an example.
In the data below, I want to look at important differences between these two protocols, as the resulting data can differ, in relation to acute responses to stressors.
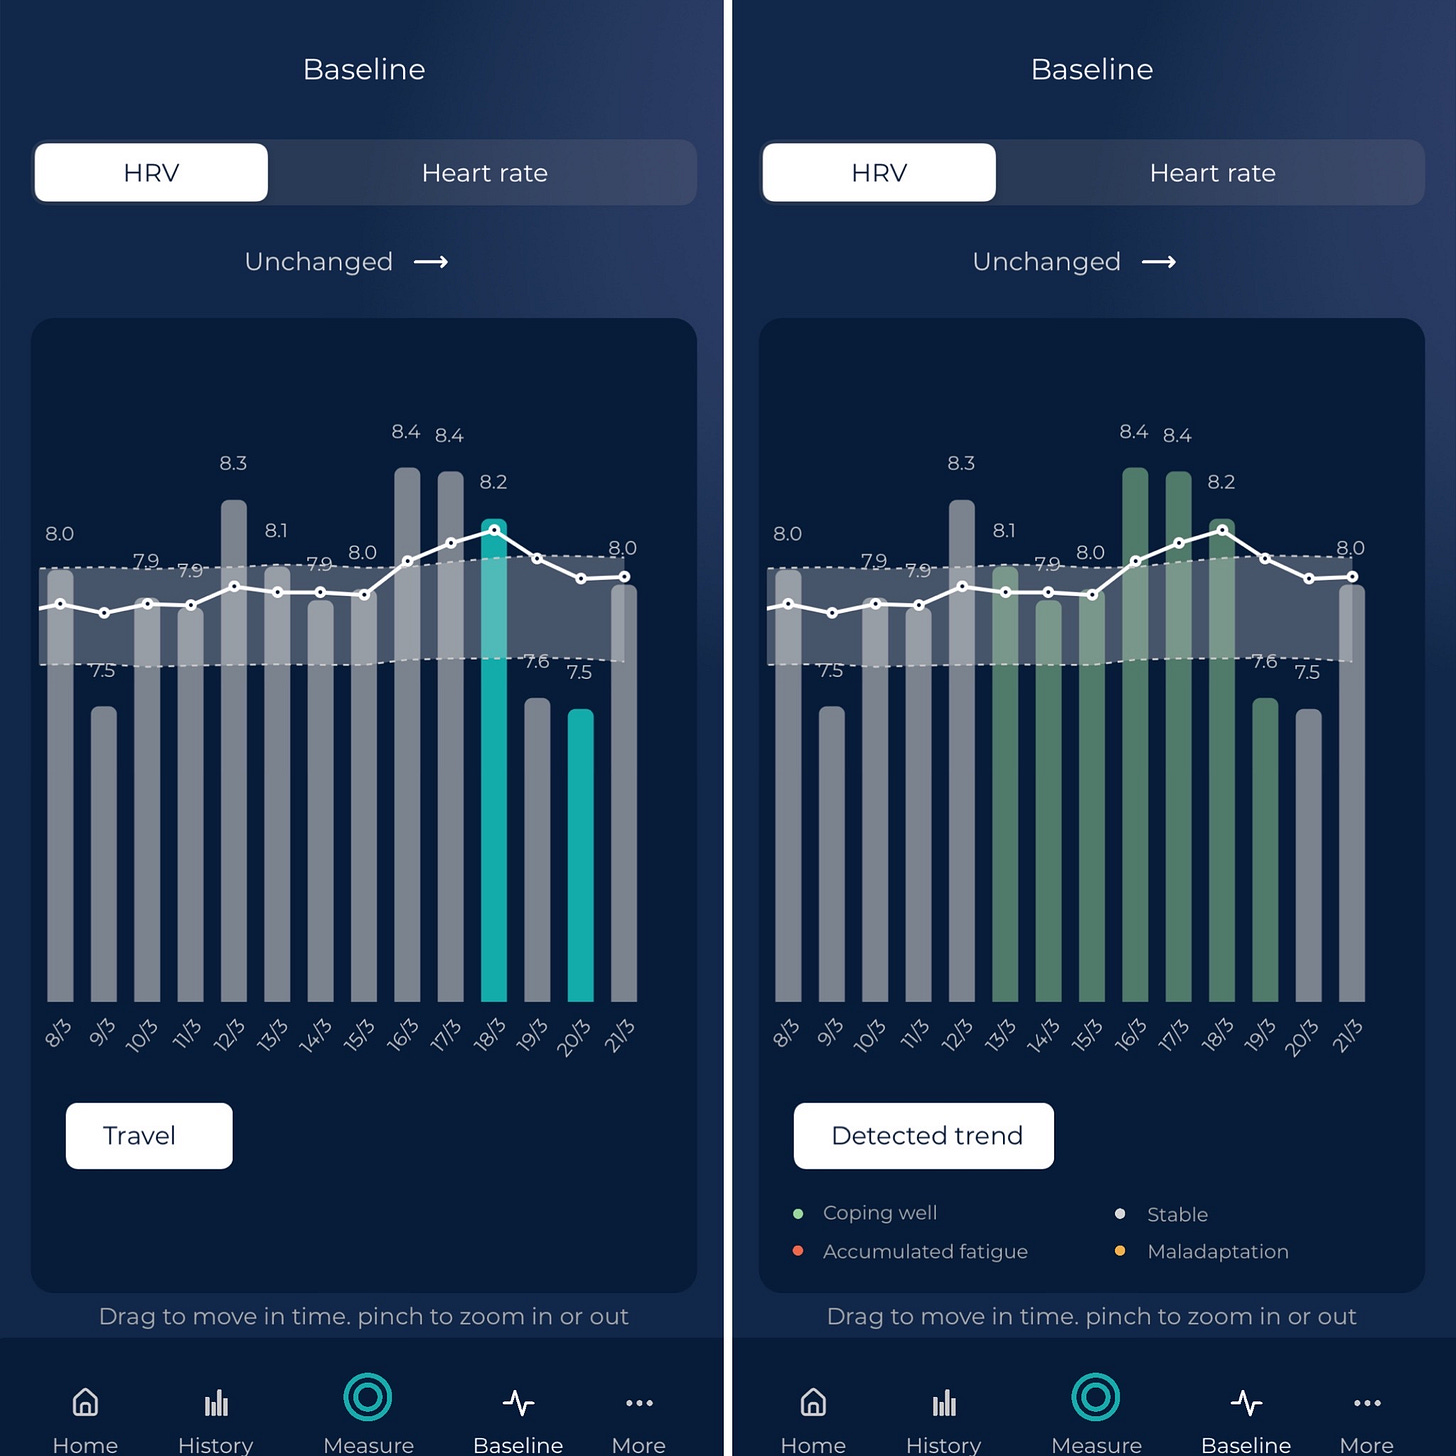
In the top plot, we can see morning HRV data taken while sitting up. As discussed a few times, this is a protocol that makes it easier to capture your stress response.
We can indeed see that both travel (color-coded) and high-intensity training (I used RPE as a simple marker of intensity) have an impact, despite baseline HRV being still within the normal range:
We have three suppressions below the normal range in the last week, when looking at morning data.
This added variability due to suppressions and quick rebounds within normal range, is what is captured by the coefficient of variation (something for next week), another important metric to determine your stress response, which you can find in HRV4Training: a higher coefficient of variation is often associated with a less than ideal response.
In night data, none of this is visible: there are no suppressions.
Sleep is a highly parasympathetic state that is less useful for capturing your stress response, especially in endurance athletes who tend to have quite low resting heart rates.
My HRV is typically good in the night, unless I am sick or stressed to a level that requires no wearable to be aware of. Data collected in the morning, while sitting, challenges the body in a way that makes it possible to capture more relevant responses.
There's more in the data than just averages and normal ranges, the variability in the data itself, over a few days (i.e. the coefficient of variation), can provide additional insights.
Morning data in this case allows us to understand that we are in a situation where we are still able to cope with the stressors imposed on the system (i.e. we bounce back right after a suppression), but that we are probably at our limit (frequent suppressions, increased coefficient of variation) a good moment to make some small adjustments to either reduce stressors or prioritize recovery, quite possibly.
I’ve also updated the post below to add this example and a few more notes.
Swallowing saliva and real-time heart rate variability (HRV)
When monitoring HRV, and measuring intentionally (e.g. first thing in the morning, as an assessment of our resting physiology), we control what we can to ensure the measurement is representative of what we are interested in: parasympathetic modulation as a proxy of the stress response.
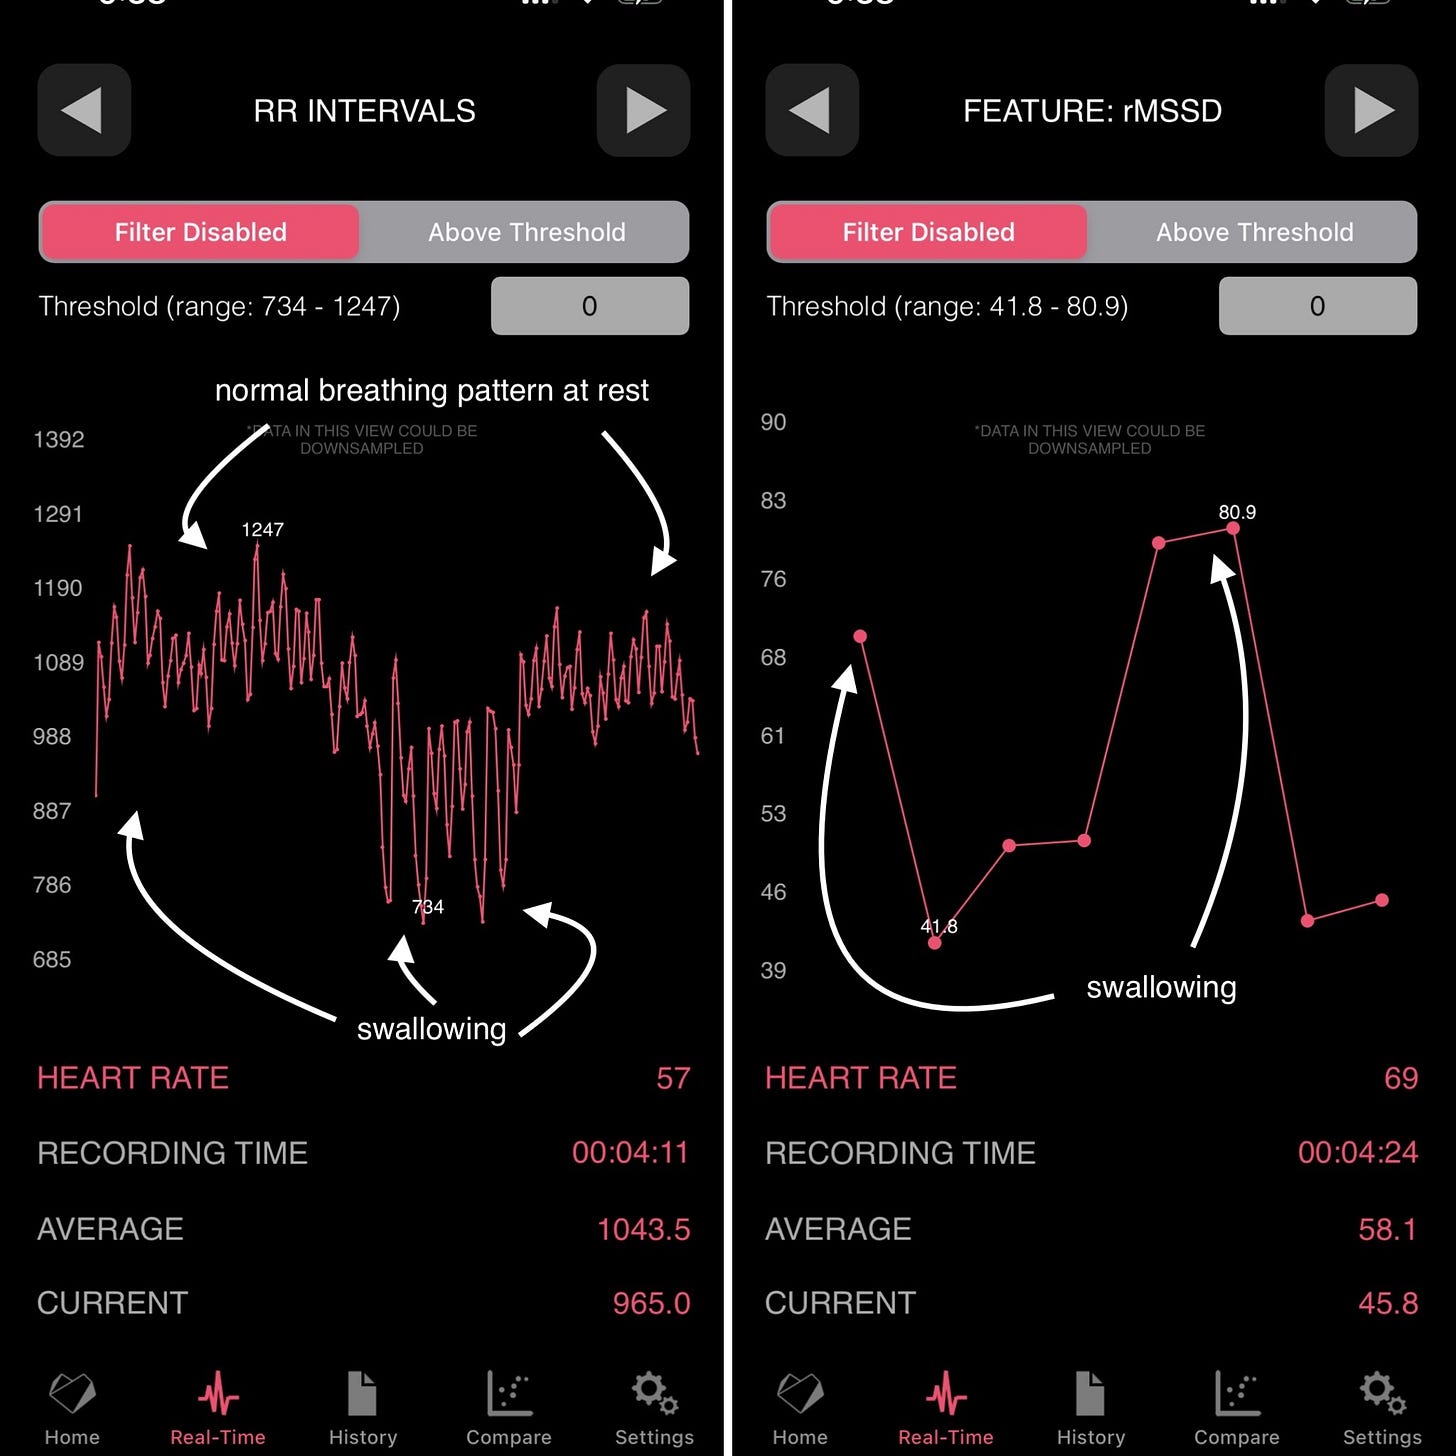
Among what we control, there's swallowing saliva: swallowing temporarily increases heart rate, hence it is something not to do when you take your measurement, as it would cause a very large difference in HRV. This is obvious to anyone who has actually looked at some data: the RR intervals time-series changes, there's an abrupt suppression for a few seconds, the regular rhythm that is normally mostly mediated by your breathing is disrupted, and as a result, HRV suddenly becomes quite high and more variable over time.
This has - of course - nothing to do with "stress", it is an artifact. Now consider that a healthy human will swallow spontaneously 18-400 times an hour - it is hardly possible to find a single minute of HRV data that is collected that is not just an artifact, because of swallowing.
Protocols were not invented to make our lives more complex. We use protocols because at times, they are the only way to meaningfully interpret collected data.
Below is some data where you can see the impact of swallowing saliva on RR intervals (beat-to-beat data used to compute heart rate variability), and on heart rate variability (the rMSSD feature) itself:

HRV when swallowing saliva is twice what it really was, at rest, when forcing myself not to swallow saliva:
actual HRV: ~45 ms
HRV when swallowing saliva: 80 ms
A "real-time stress monitor" would, of course, detect lower stress or relaxation or whatever you want to call it, in the minutes in which my HRV doubles. The relationship between heart rate variability and stress is valid only under certain circumstances: outside of those circumstances, HRV is impacted by many other factors that have nothing to do with how stressed you are. Similar artifacts happen when you simply drink water: also, nothing to do with stress.
Use good tools and good protocols, look at the actual data (never at “stress estimates”), and you will be able to use HRV more meaningfully.
Discount for Pro: 20% off 🖥️
HRV4Training Pro is the ultimate platform to help you analyze and interpret your physiological data, for individuals and teams.
You can find a guide here.
Try HRV4Training Pro for free at HRVTraining.web.app or use promo code SCIENCE for 20% off.
In the app, Pro brings the normal values view, which can help contextualizing longer-term changes, as well as rMSSD on the homepage, see an example below:
See you next week!
Marco holds a PhD cum laude in applied machine learning, a M.Sc. cum laude in computer science engineering, and a M.Sc. cum laude in human movement sciences and high-performance coaching.
He has published more than 50 papers and patents at the intersection between physiology, health, technology, and human performance.
He is co-founder of HRV4Training, advisor at Oura, guest lecturer at VU Amsterdam, and editor for IEEE Pervasive Computing Magazine. He loves running.
Social:
Twitter: @altini_marco.
Personal Substack.


