Week 32: physiology, training load and subjective data
a comprehensive overview of your data

hi there 👋
I hope everything is well.
HRV4Training Pro features an overview page that aims to ease the interpretation of HRV data for your own analysis as well as your team data, by contextualizing it with respect to training load and subjective data.
The page shows the normal range, daily and weekly averages for HRV and heart rate data. You can optionally highlight each recording with different annotations, and add training load and subjective parameters as context in additional plots. Correlations are reported for the selected parameters.
This is probably the most useful page as it shows how things are changing over time, with respect to your frame of reference (normal range), and context (annotations, training, subjective data).
The page is structured in 4 areas:
Physiology
Training load
Subjective data
Correlations between selected parameters
Physiology
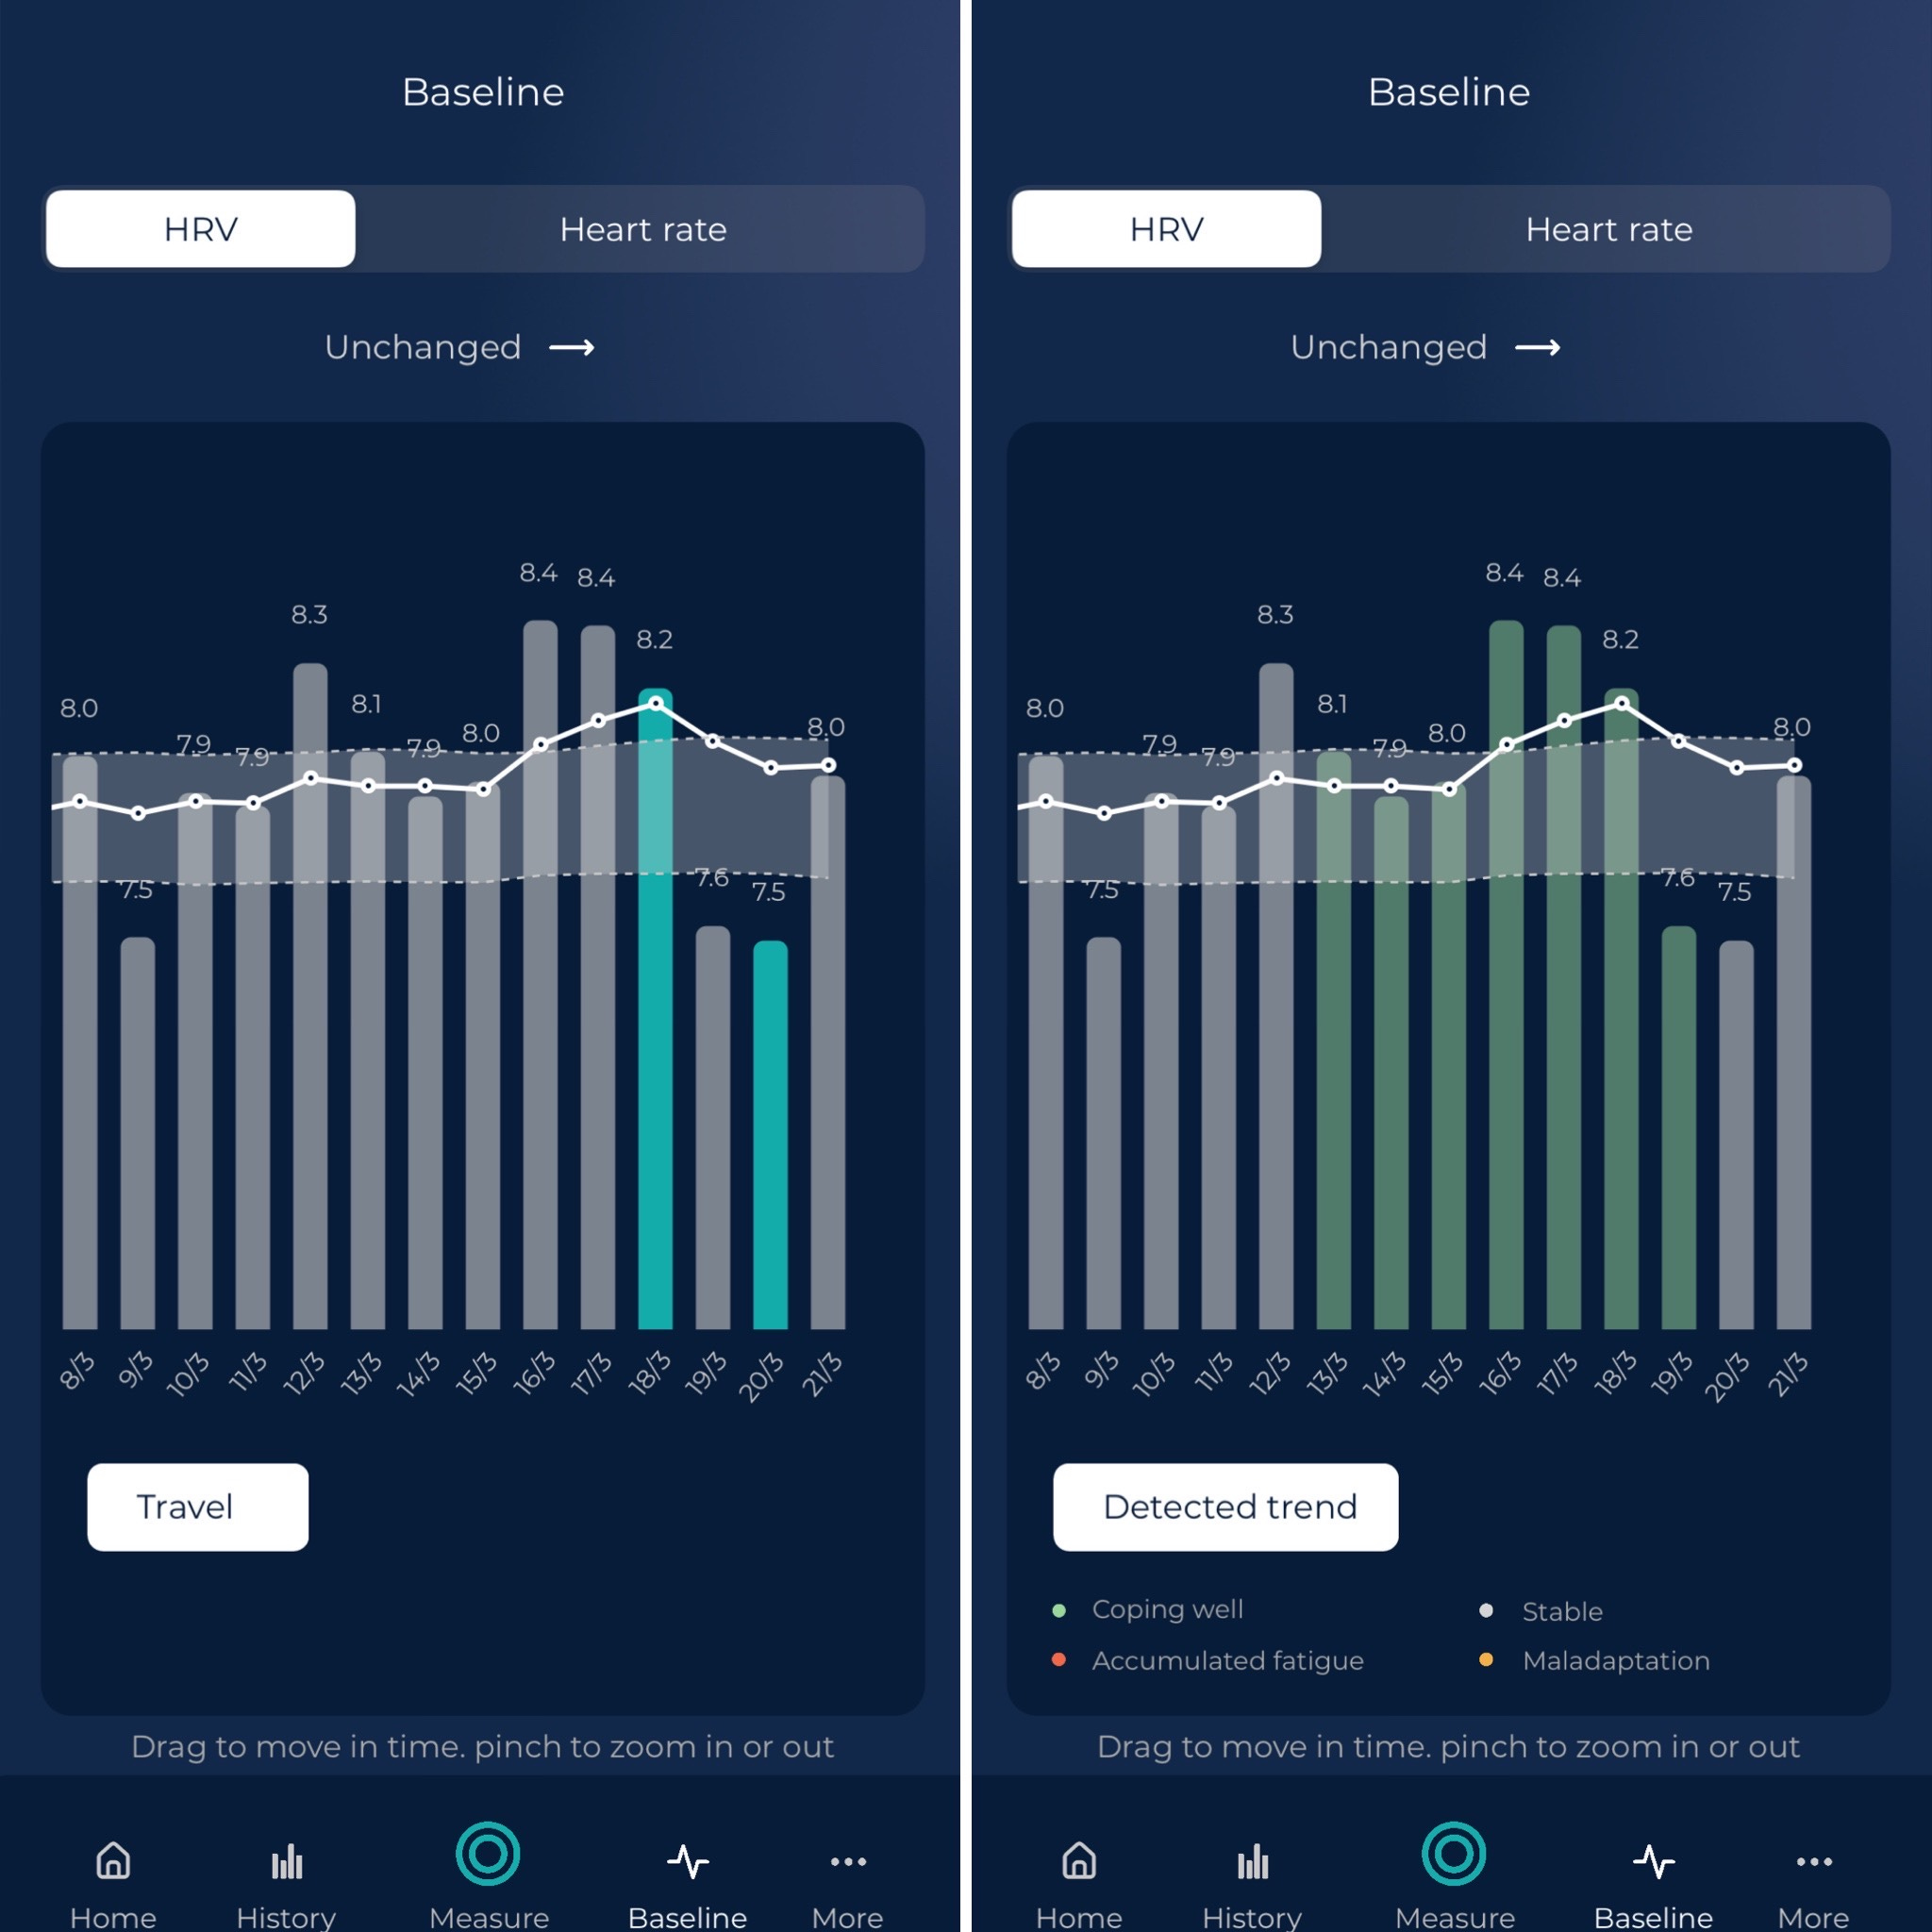
In the first graph, you can visualize HRV (a logarithmic transformation of rMSSD, as often reported in the scientific literature), rMSSD, or heart rate. For the selected parameter, HRV4Training Pro will show a 7-day moving average (what we call the baseline) and a normal range (the shaded area that represents a positive physiological response, i.e. stability).
This visualization allows you to easily determine which deviations are meaningful, and which ones are just part of normal day-to-day variability.
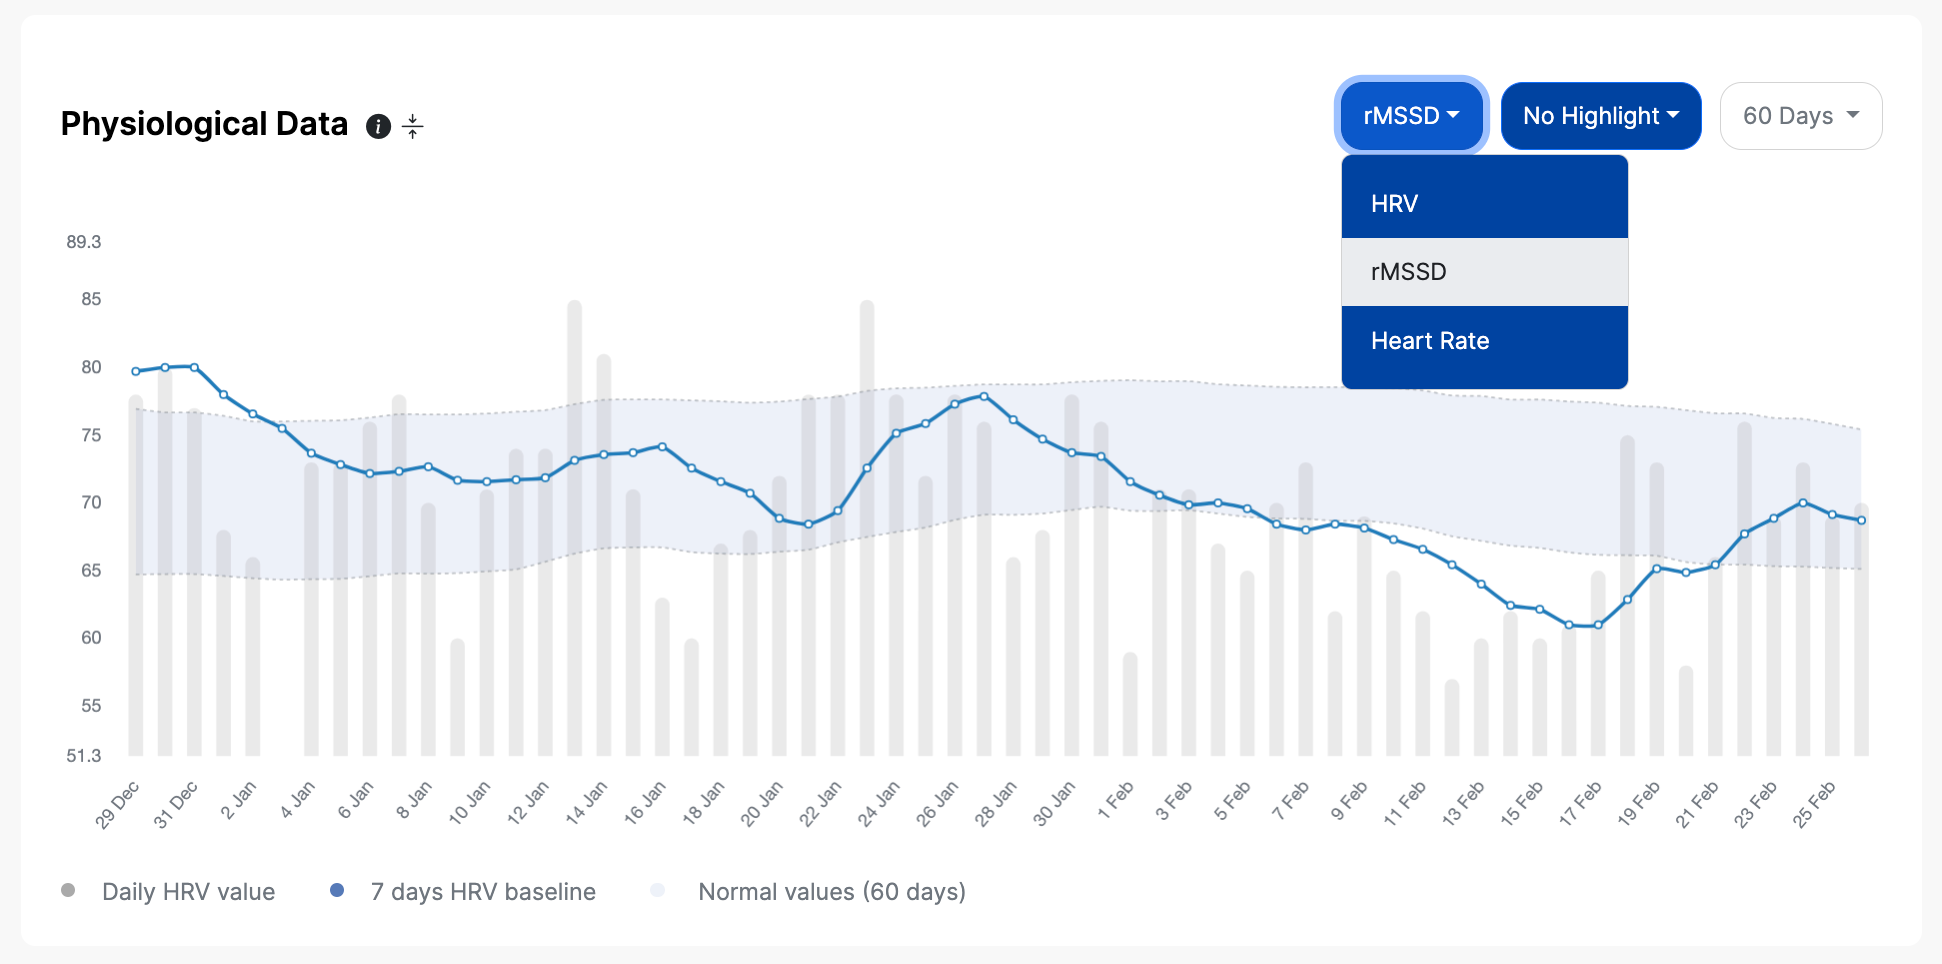
You can also color-code the bars based on a number of annotations or analytics, for example, training intensity distribution below:

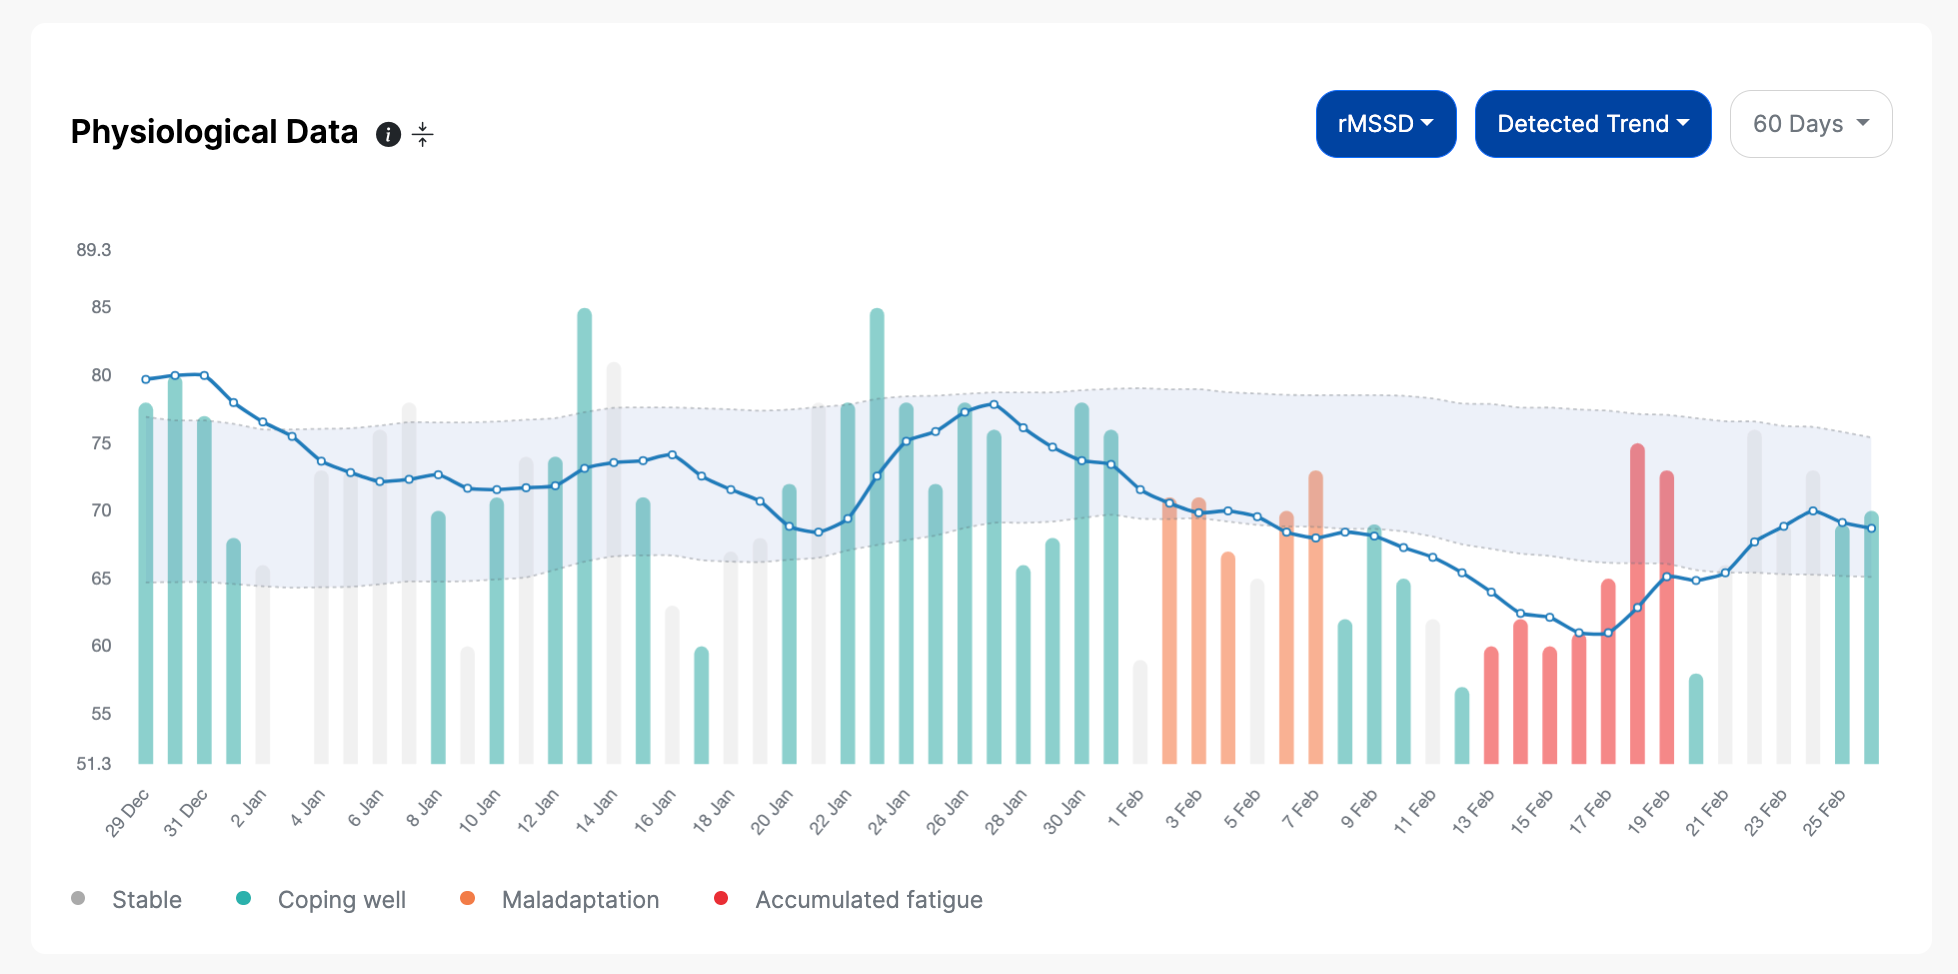
Typically, I use the detected trend color coding, as this algorithm looks at multiple physiological parameters in the medium to long term, and provides additional insights beyond the daily scores or HRV data (more information about how this works, here).
We can see below how a period of poor health followed by a minor injury are marked as maladaptation and accumulated fatigue:
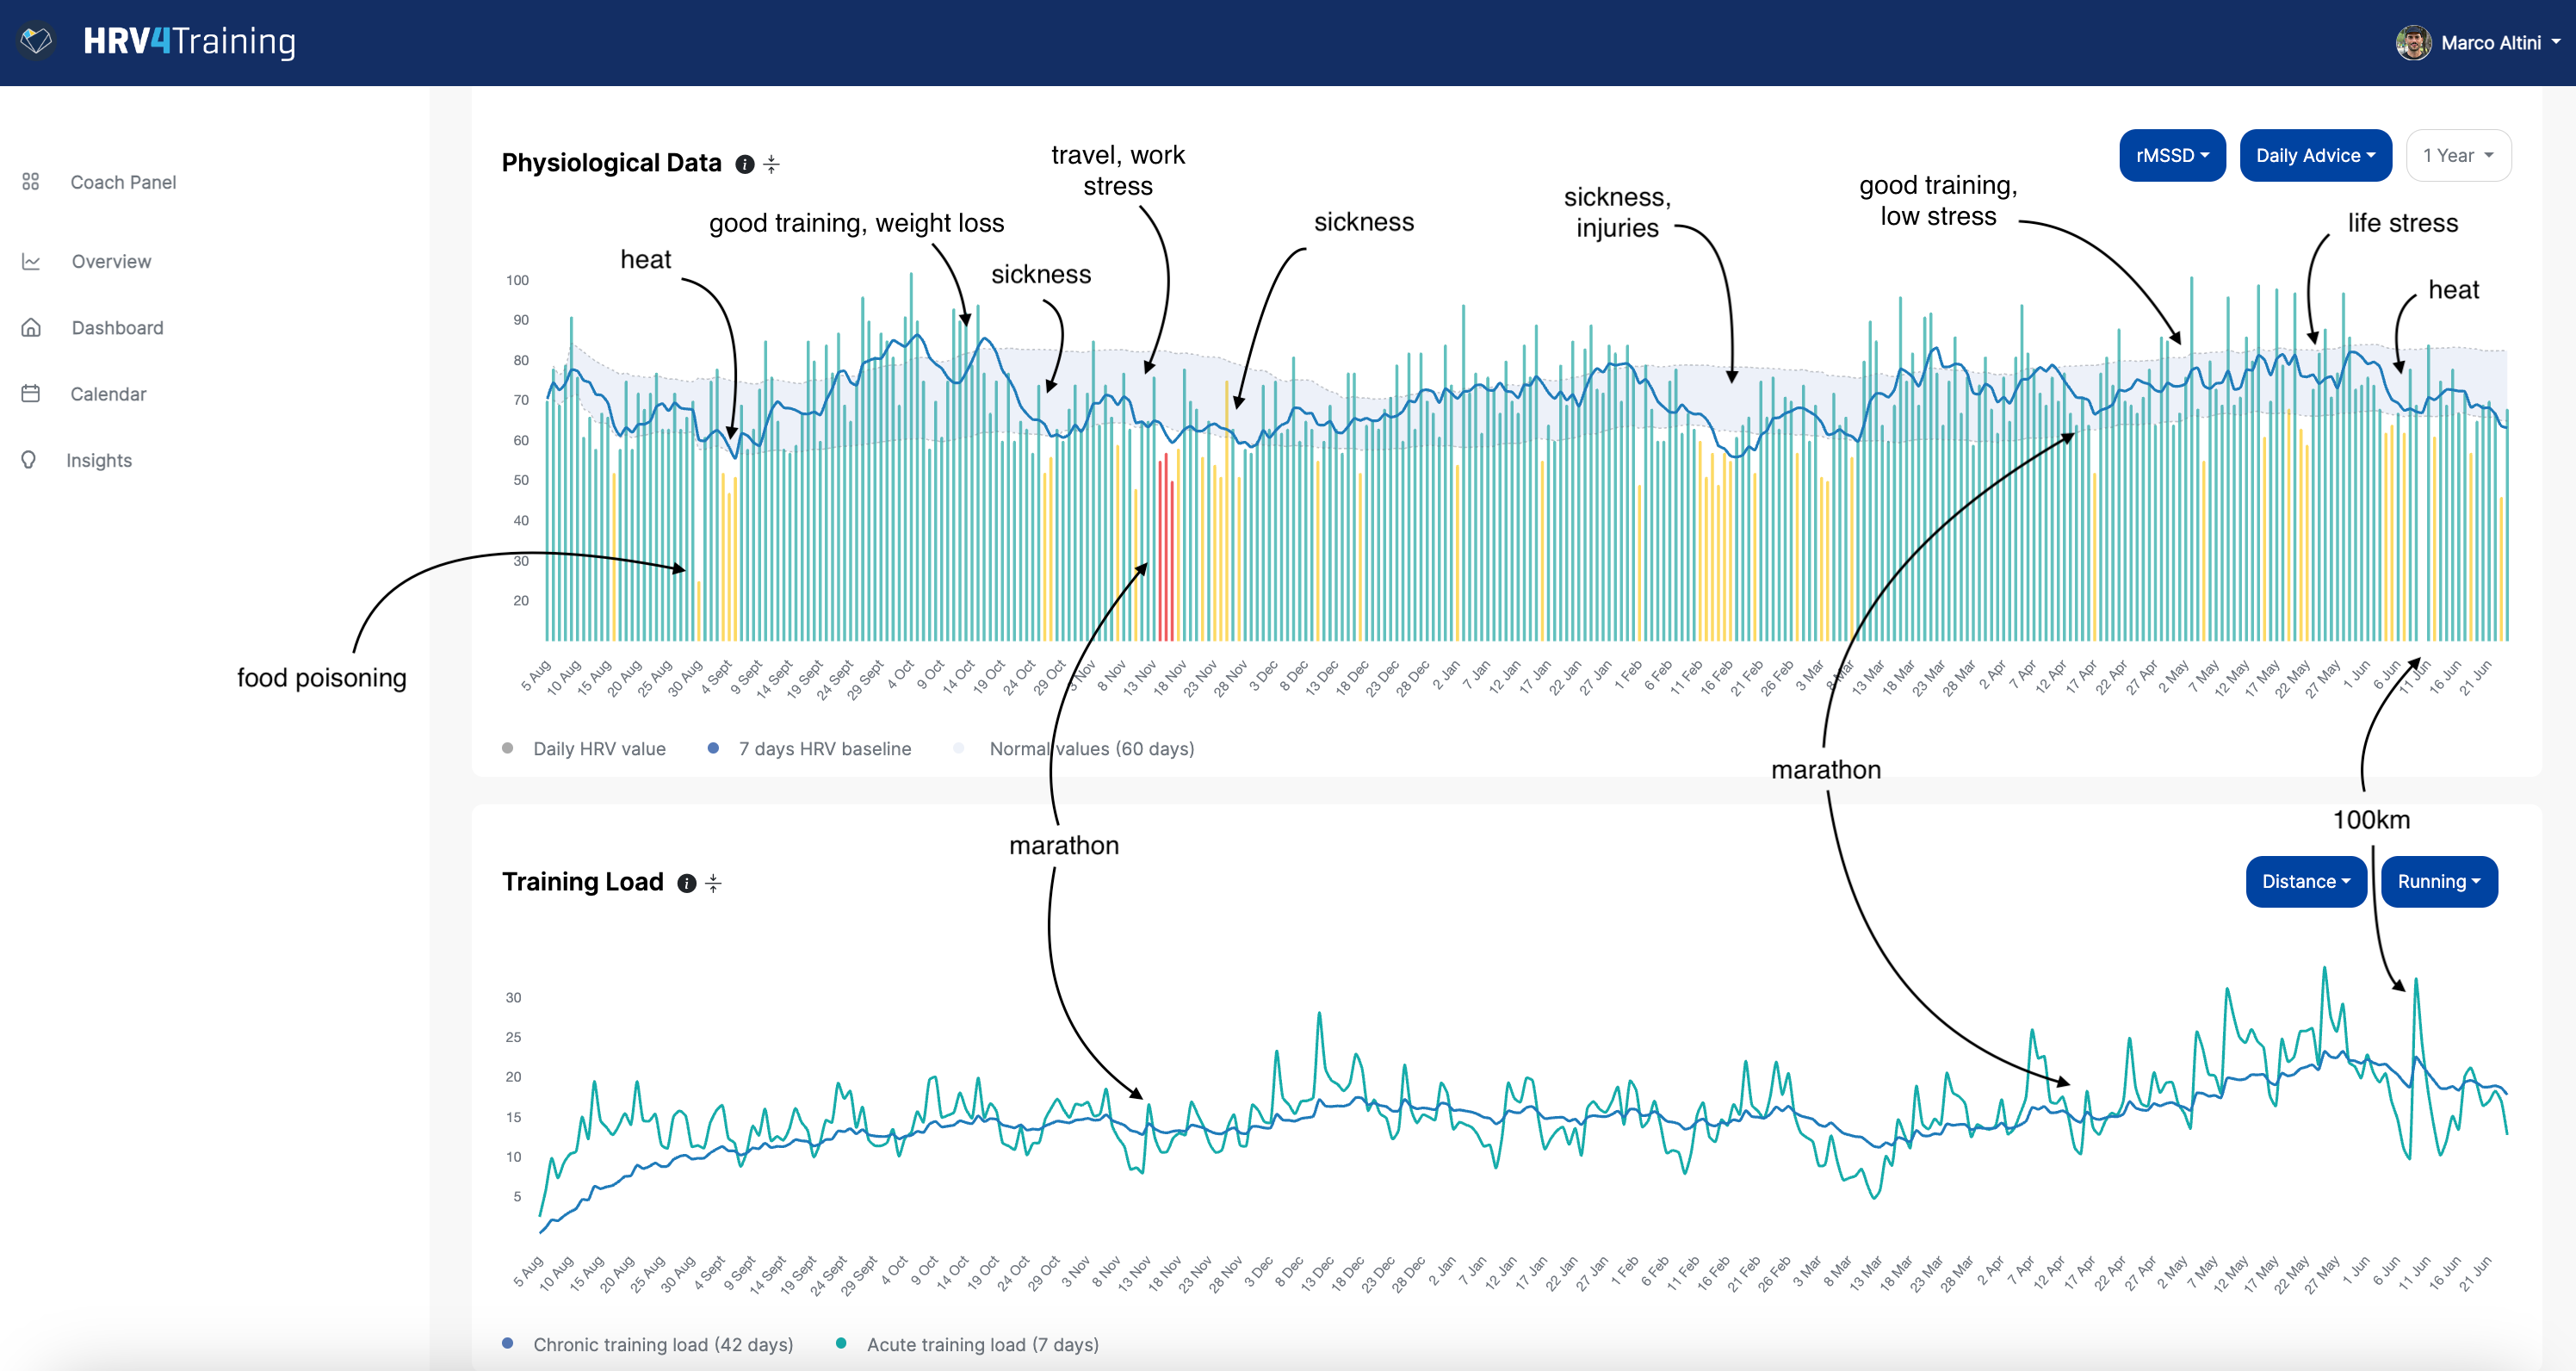
Finally, we added the possibility to select custom date ranges, so that you can easily look back at specific periods to see your physiological response (e.g. in relation to a race or other event):

Each graph can also be collapsed, if you prefer to only look at the other ones:

Training load
Training load is provided as context on the Overview page. In particular, acute and chronic loads are computed with standard models using 7 and 42 days of data, so that you can quickly see how chronic load is trending, and periods of higher or lower acute load.
The training impulse variable used to build these plots can be selected among a number of parameters that might be relevant for your sport: distance, duration, RPE, RPE * duration, TSS, relative effort, etc.
You can also filter by sport type, in case you log more sports but are interested in checking training load for one sport in particular:

Subjective data
Subjective data is annotated in HRV4Training via the morning questionnaire and is a key aspect of using HRV effectively, as I cover in my guide to incorporating HRV in your training.
A number of subjective parameters can be optionally logged in the app, for example, fatigue, muscle soreness, lifestyle stress, sleep quality, motivation to train, perceived performance, environmental variables, etc.
We provide the 7-day moving average and normal range also for subjective data, as similarly to objective data, here we also have meaningful deviations, and deviations that are just part of day-to-day variability.

Correlations
In the new HRV4Training Pro, we have added a section that includes correlations between the selected parameters. There will still be a more comprehensive correlation page, but I think it can be valuable to quickly look at this analysis for the parameters we are normally interested in.
For example, if I select rMSSD in the physiology graph, and running distance as training load, as well as fatigue as subjective data, I would get the following:

The analysis looks at day-to-day correlations, so the daily relationship between these variables (typically quite weak as many different parameters can impact a single measurement) and baseline correlations, hence the longer-term relationship between trends in the same variables (which often shows stronger associations).
While we need to keep in mind the shortcomings of correlations, e.g. when we do see an association between variables, it might not necessarily mean that there is a causal relationship, and other variables might be driving the correlation (or it might just be a random outcome). Similarly, when we do not see an association, there could actually be one, which is confounded or hidden by other variables. This being said, looking at long-term correlations can be useful to capture possible associations.
Here is another useful article that might help interpreting the data:

Next week, I’ll discuss an interesting study that was just published, looking at the relationship between HRV, training load and subjective data, similarly to what you can analyze in HRV4Training Pro.
Articles and updates from July
In my personal newsletter for last month: my past as a gymnast, heart rate variability protocols and limitations, detecting parasympathetic saturation using HRV4Training, research updates, clubbing in the early 2000s, and more.
Discount for Pro: 20% off 🖥️
HRV4Training Pro is the ultimate platform to help you analyze and interpret your physiological data, for individuals and teams.
You can find a guide here.
Try HRV4Training Pro for free at HRVTraining.web.app or use promo code SCIENCE for 20% off.
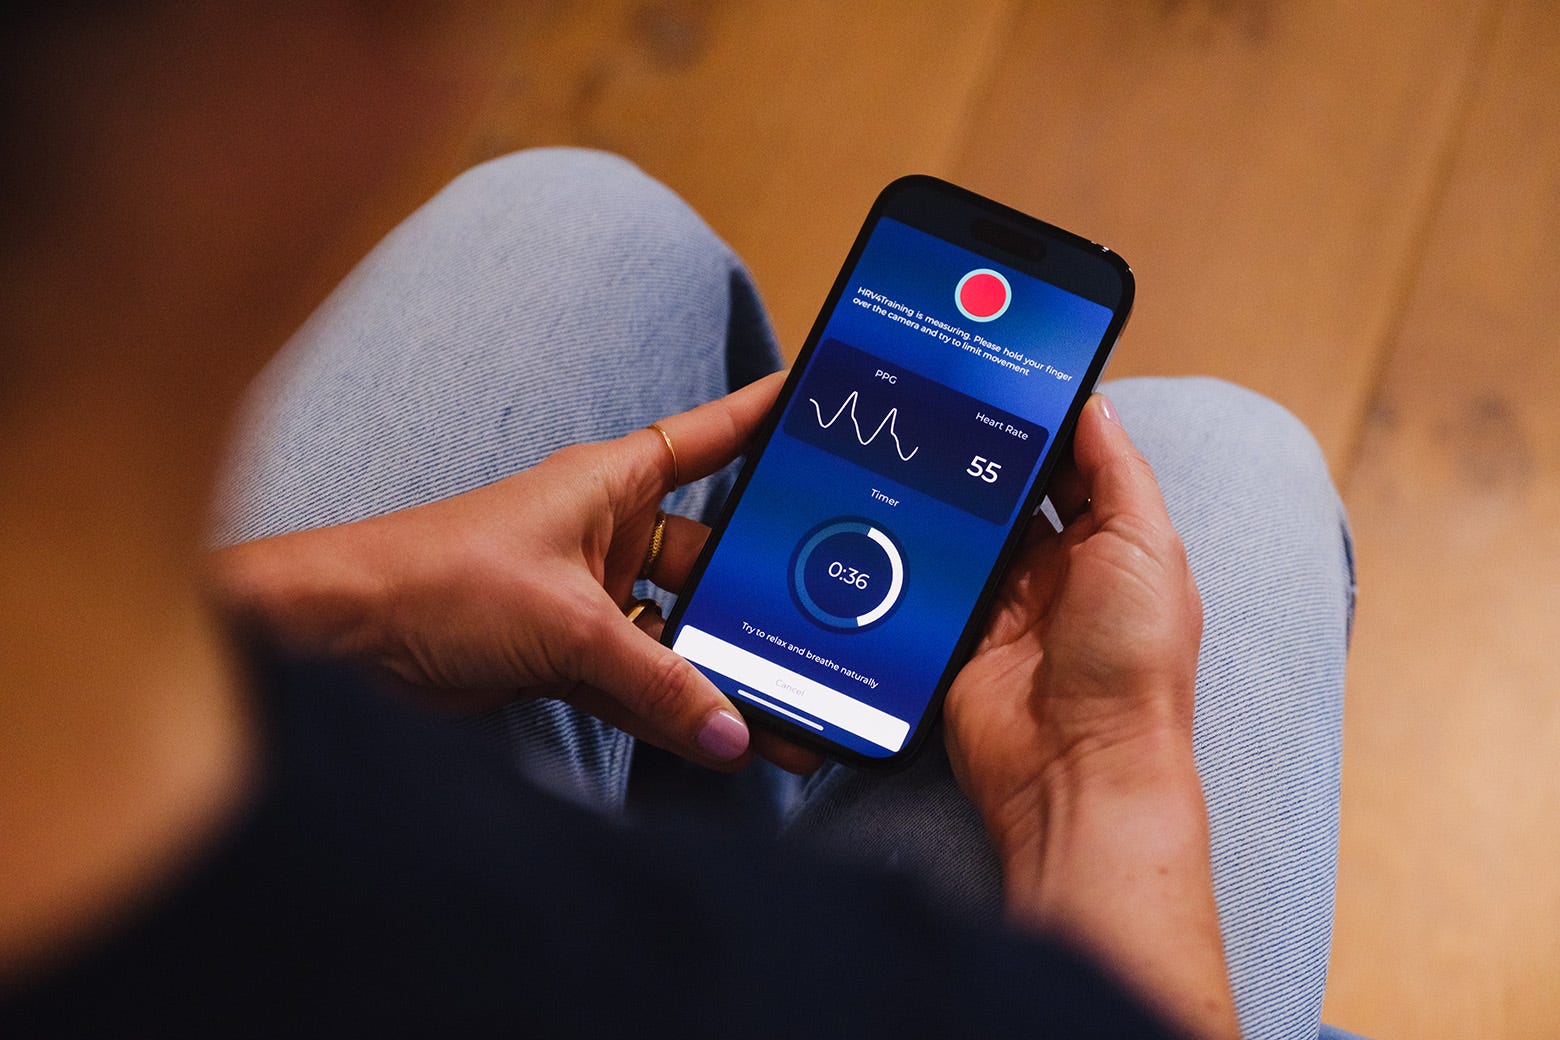
In the app, Pro brings the normal values view, which can help contextualizing longer-term changes, as well as rMSSD on the homepage, see an example below:
See you next week!

Marco holds a PhD cum laude in applied machine learning, a M.Sc. cum laude in computer science engineering, and a M.Sc. cum laude in human movement sciences and high-performance coaching.
He has published more than 50 papers and patents at the intersection between physiology, health, technology, and human performance.
He is co-founder of HRV4Training, advisor at Oura, guest lecturer at VU Amsterdam, and editor for IEEE Pervasive Computing Magazine. He loves running.
Social:
Twitter: @altini_marco.
Personal Substack.