Week 11: Measurements and Estimates
Week 11: Measurements and Estimates
A chat with Stephen Seiler and Trevor Connor for Fast Talk Labs

hi there 👋
I hope everything is well.
A few weeks ago I had a good chat with Trevor Connor and Stephen Seiler, covering important differences between metrics that are measured by the devices we use, and metrics that are estimated.
Broadly speaking, measurements require that we use a sensor that can quantify what we are interested in. Normally, measurements can be validated against a reference or gold standard. For example, heart rate is a measurement, and measuring heart rate with optical sensing, the way a wearable does, can be validated against an electrocardiogram (ECG).
On the other hand, estimates are guesses based on somewhat related parameters. Some guesses are quite simplistic (e.g. your maximal heart rate based on your age), while others are more sophisticated (e.g. your sleep stages based on HRV, temperature and movement data), but they are still guesses, and tend to have larger errors. Some estimates are completely made up and cannot even be validated, because no reference exists (e.g. readiness or recovery scores, stress scores, etc.).
In the podcast below, we discuss training and recovery metrics, and the implications of relying on (somewhat made-up) estimates, which seems to be the current trend.
I hope you will find some useful pointers in there.
I had also covered some of the aspects discussed in our conversation on my blog a few months ago, in particular in the context of metrics derived from wearables.
Check it out here:

A case study
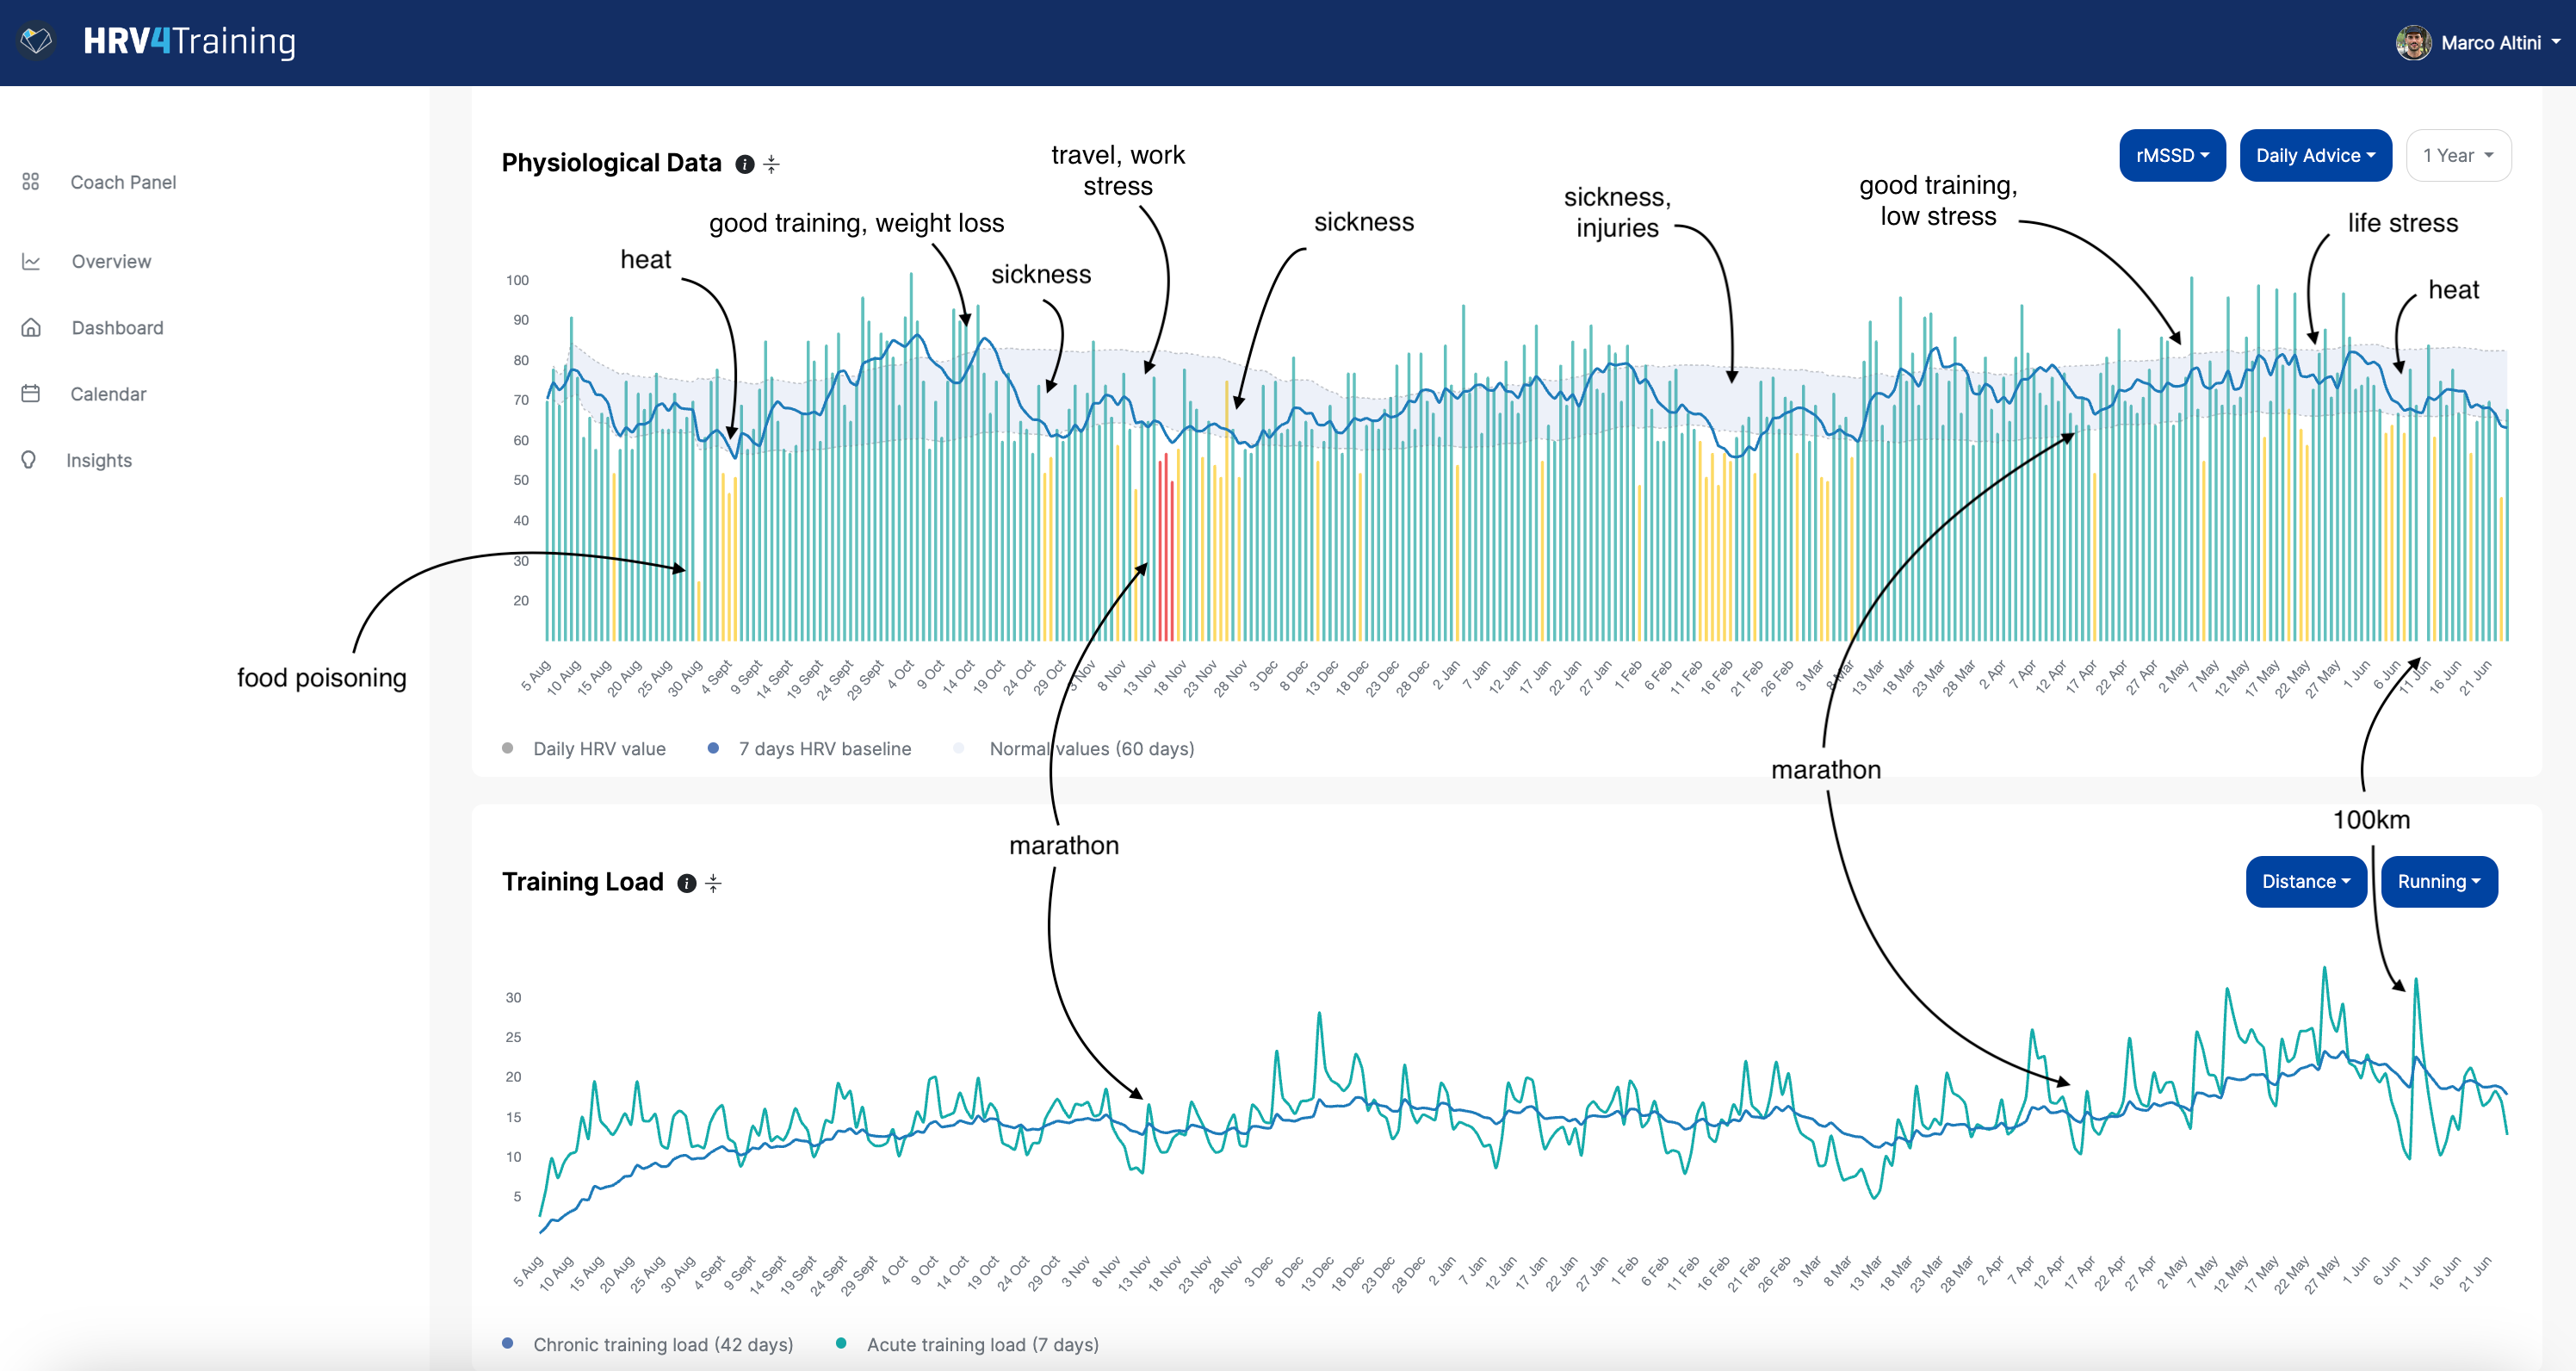
With the data below, I want to highlight something important, but often overlooked, especially when looking at long-term trends or using devices and apps unable to show you everything you need (i.e. daily measures, baselines, and normal ranges).
In the data below you can spot two negative signs in terms of the physiological response, both happening when perceived stress is increasing:
Frequent suppressions below the normal range
High day-to-day variability (or in other words, high coefficient of variation)
In particular, I want to focus on the high coefficient of variation. A high coefficient of variation is tricky, because the baseline (blue line here), or average as you'd see it on another platform, fails to capture any issues, given that some days HRV is quite high.
However, high day-to-day variability (data jumping around a lot) is also a sign of a negative response (see this blog for a broader discussion on this) and indeed, as things stabilize in the last week, the data is not only not suppressed, but does not spike either, remaining mostly within the normal range: this is an example of a good response.

The visualization above is part of the Overview page in HRV4Training Pro.
Discount for Pro: 20% off 🖥️
HRV4Training Pro is the ultimate platform to help you analyze and interpret your physiological data, for individuals and teams.
You can find a guide here.
Try HRV4Training Pro for free at HRVTraining.web.app or use promo code SCIENCE for 20% off.
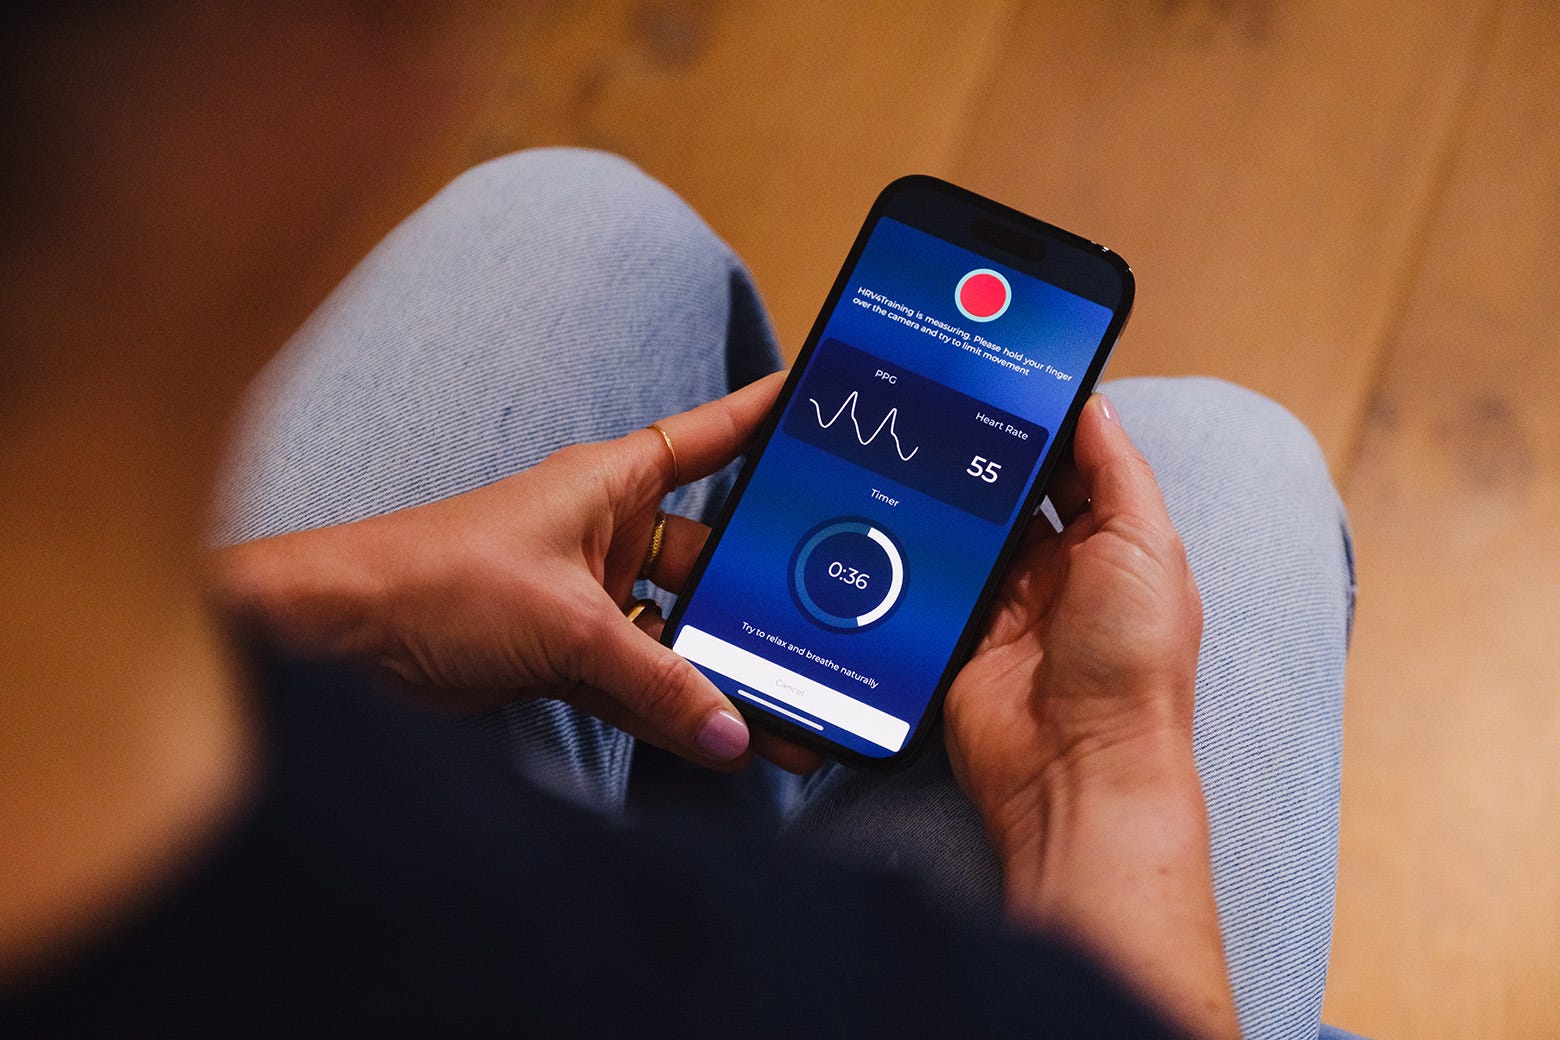
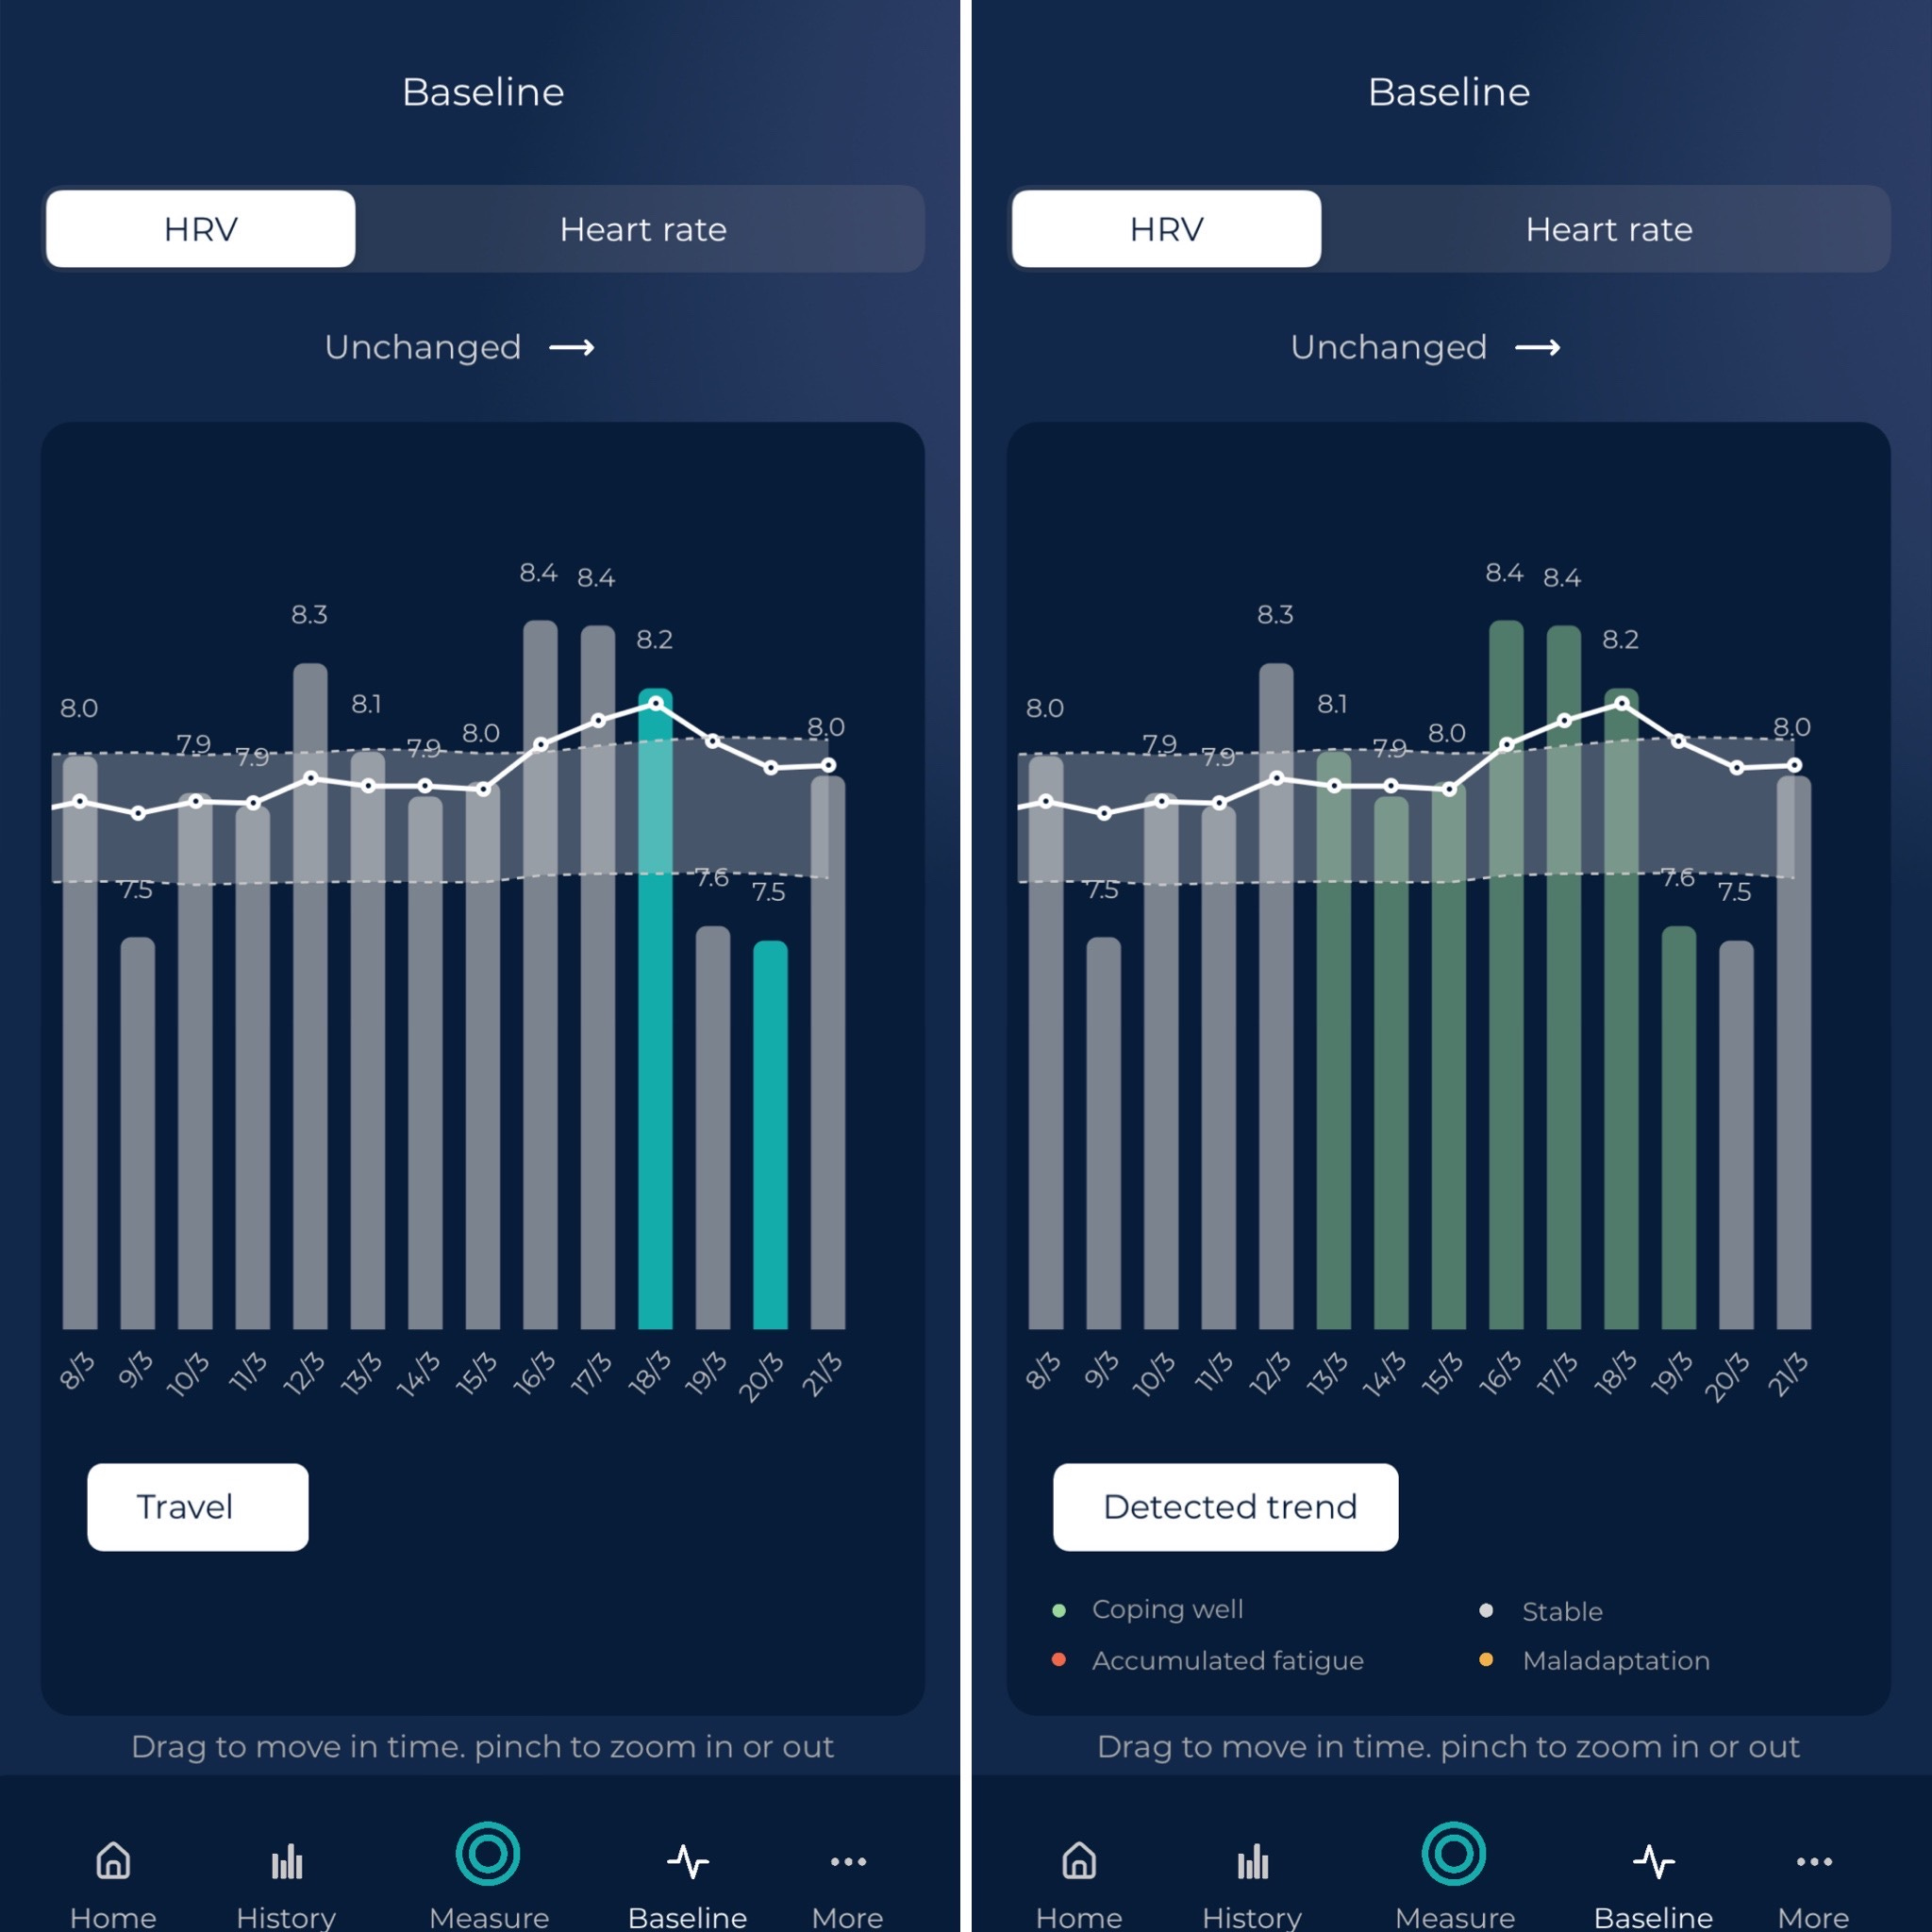
In the app, Pro brings the normal values view, which can help contextualizing longer-term changes, as well as rMSSD on the homepage, see an example below:
See you next week!

Marco holds a PhD cum laude in applied machine learning, a M.Sc. cum laude in computer science engineering, and a M.Sc. cum laude in human movement sciences and high-performance coaching.
He has published more than 50 papers and patents at the intersection between physiology, health, technology, and human performance.
He is co-founder of HRV4Training, advisor at Oura, guest lecturer at VU Amsterdam, and editor for IEEE Pervasive Computing Magazine. He loves running.
Social:
Twitter: @altini_marco.
Personal Substack.