hi there 👋
I hope everything is well.
A recent scientific paper, titled “Heart rate variability-guided aerobic training without moderate-intensity enhances submaximal and maximal aerobic power with less training load” (full text here), authored by Morinaga and Takai of the National Institute of Fitness and Sports in Kanoya, Japan, looks once again at HRV-guided training.
Similar to what we have seen in previous research (e.g. from Vesterinen or Javaloyes), the study reports improved performance with less high-intensity training. The hypothesis for HRV-guided training is that by providing the most appropriate training stimuli in a timely manner, when your body is ready to take it, positive adaptations will occur and you will be able to improve performance. Normally a timely manner means when your daily HRV or baseline HRV is not suppressed, with respect to your historical data. This principle makes intuitive sense, as needless to say, our capacity to handle stress is limited, and while periodization is an important starting point, we need to be able to add flexibility and provide the right stimulus at the right time, which is what HRV allows us to do.
Going hard when our body is in a state highlighting a poor physiological response, such as when our HRV is below our normal range, can be done, but typically does not lead to the same improvements over time.
When we do the work matters.
Study protocol and findings
This study examined the effects of HRV-guided aerobic training on submaximal and maximal aerobic power compared to traditional block periodization. Over five weeks, participants were divided into two groups: HRV-guided training and block periodization. The HRV-guided training group adjusted their training intensity daily based on morning HRV readings, while the block periodization group followed a fixed schedule with two weeks of overload followed by two weeks of tapering.
The HRV-guided training group demonstrated greater increases in submaximal and maximal aerobic power (e.g., a 15% increase in maximal aerobic power vs. 14% in BP) despite a significantly lower training load. They spent more time at low intensities and less time at high intensities. Additionally, HRV-guided training showed reduced interindividual variability in adaptation (a low coefficient of variation in the response). This last point is also quite important, as with individualized training, we do care to see that all individuals benefit in a similar way, as opposed to just group averages and inconsistent responses to the same stimulus.
This study showcases the practical application of what I have built over the years, using morning HRV data to successfully adapt training loads based on deviations from your own normal range.
The results—greater aerobic gains, lower strain, and reduced variability in responses—highlight the effectiveness of this approach. Note that all of this is obtained with morning measurements of resting physiology, without the need to wear anything 24/7.
How can you use a similar approach?
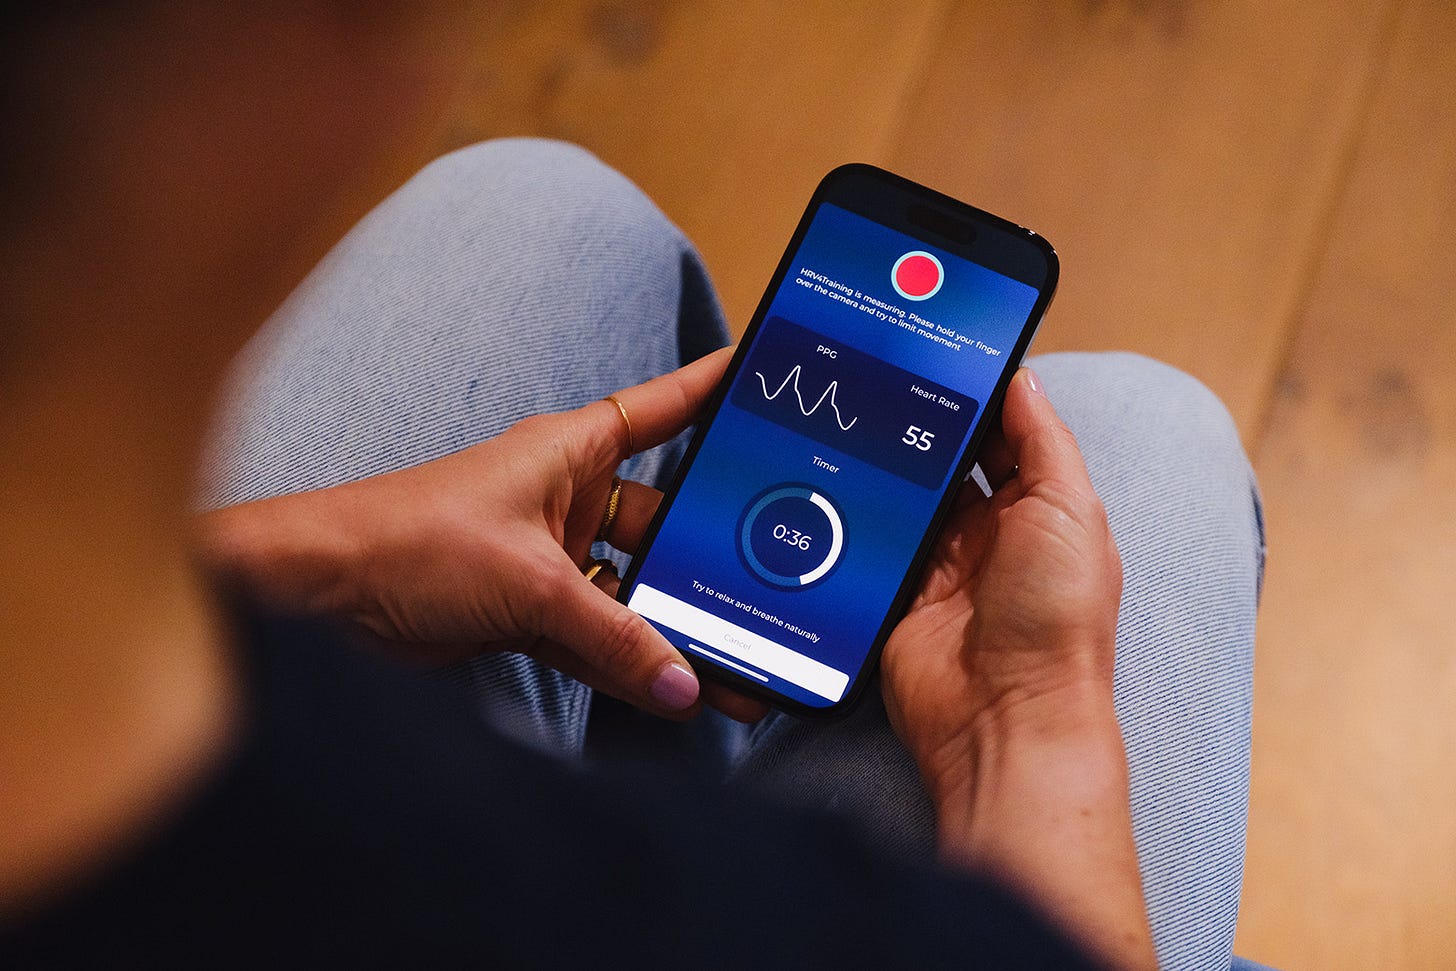
Take a morning measurement using HRV4Training. See best practices here.
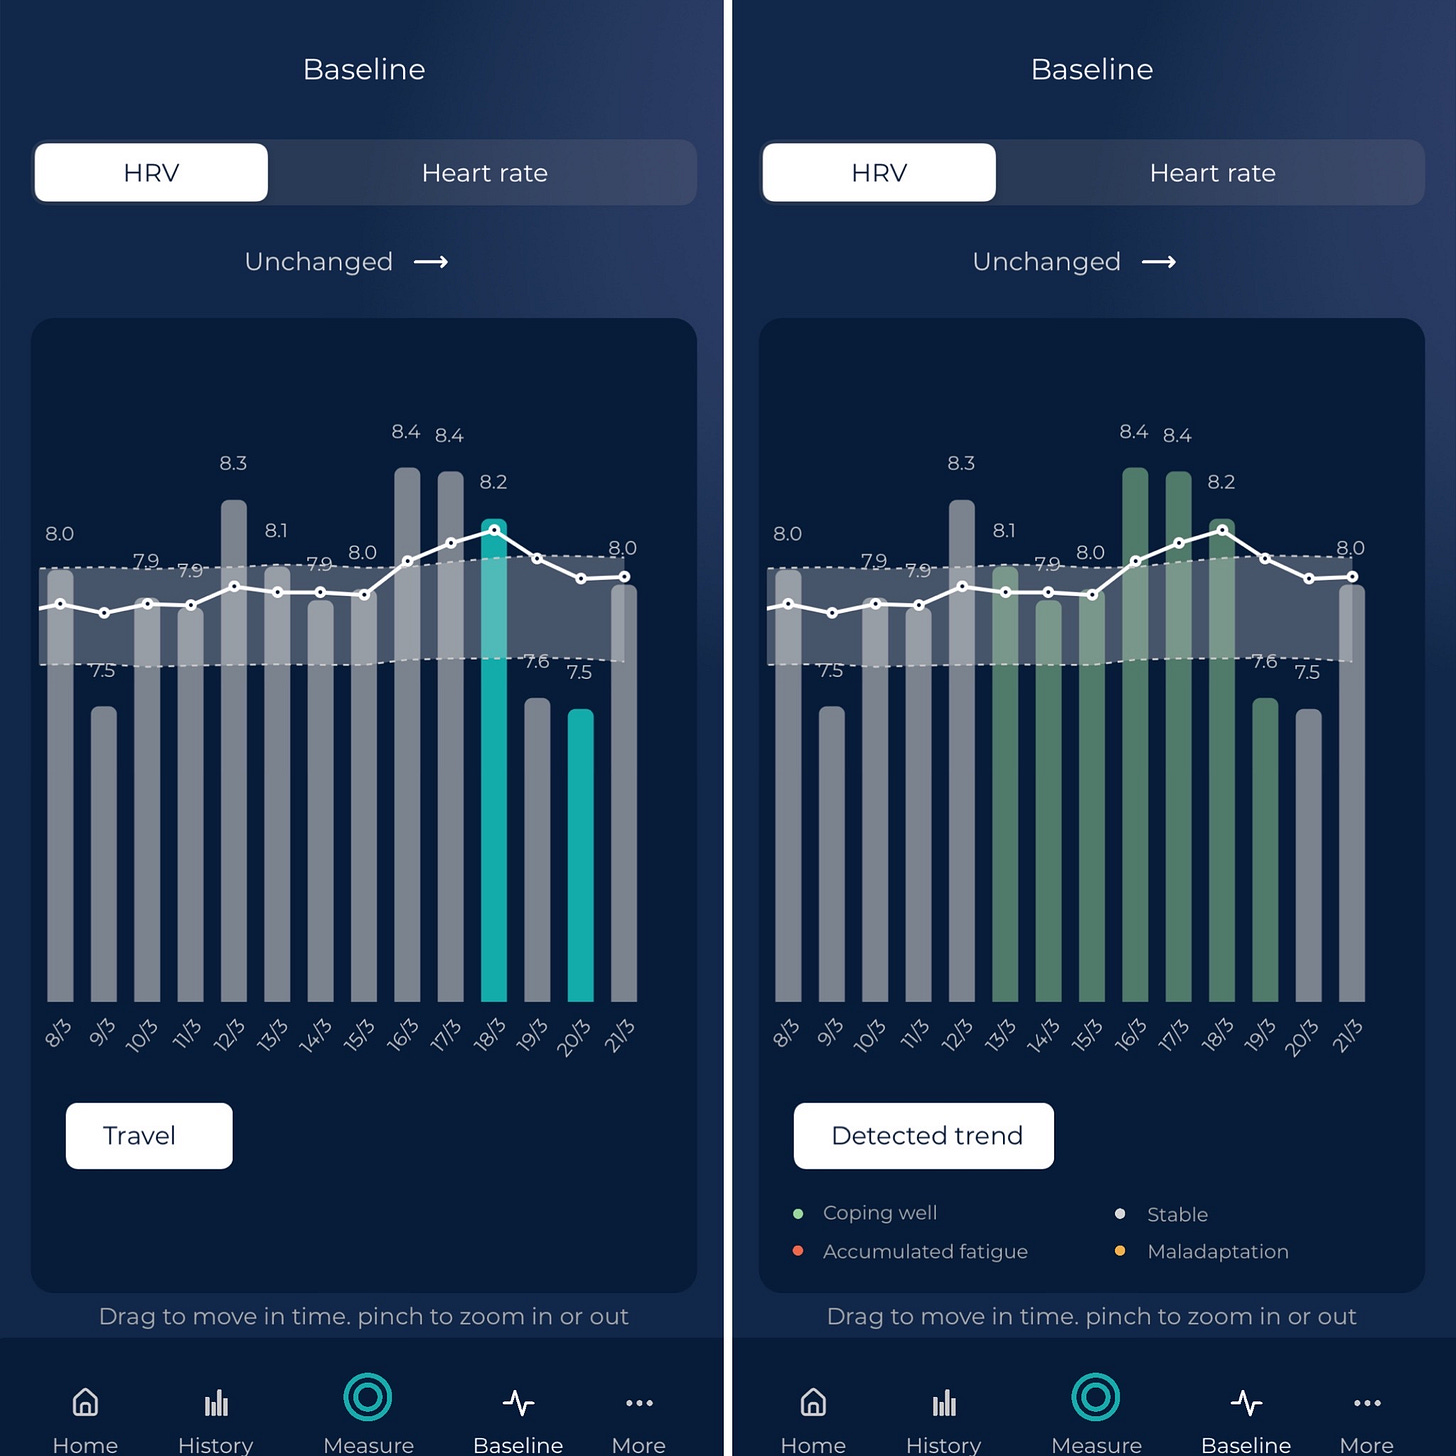
Look at your response with respect to your normal range, something HRV4Training provides for you in the homescreen of the app.
Reduce training intensity if your daily HRV (or baseline HRV) are below your normal range.
These are the only scientifically valid steps to use physiological data in a way that has consistently led to improvements.

As a coach, you can do something similar for your athletes easily, using HRV4Training Pro, where you can see normal ranges, daily HRV and baselines for all of your athletes.
Learn more, here.

If you are serious about your health and performance and are interested in monitoring how your body is responding to various stressors, do yourself a favor and measure your physiology intentionally (i.e. in the morning), while relying on actual validated physiological measurements, and ignoring all sorts of made-up metrics (readiness, recovery, sleep and stress scores, to begin with). Anything else is a toy that provides non-reproducible results and can change without you even being aware, any day (e.g. via a software update).
Take control.
More Research: Continuous HRV data
If you still had doubts about how bad wearables are at continuous HRV data, and how much they are fooling you with 24/7 “stress estimates”, a recent paper (full text here) looking at raw data from one of the major manufacturers, shows the following:
Whoop’s coverage dropped from 77%–88% during the night (far from ideal) to 19%–31% during the day (in other words, you get one RR interval out of 4 or 5). There is no use for this data, as a single artifact in HRV data can change your HRV 2-3x, let alone so many gaps.
Errors and variability were exacerbated by movement and posture changes during the day (almost twice the error during the day wrt the night), limits of agreement were from -32 ms to +26 ms. That range is larger than most people’s HRV, especially during the day when values are lower.
All in line with what I had discussed in this blog a long time ago. No surprise none of this raw data is actually shown to you, but only used to make things up (“stress” or else). Garbage in, garbage out.
Measure intentionally, ideally in the morning, while seated, and you will have more useful data than by wearing a poor-quality device 24/7 (let alone how much cheaper it is).
Less is more when it comes to HRV.
Discount for HRV4Training Pro: 20% off 🖥️
HRV4Training Pro is the ultimate platform to help you analyze and interpret your physiological data, for individuals and teams.
You can find a guide here.
Try HRV4Training Pro for free at HRVTraining.web.app or use promo code SCIENCE for 20% off until the end of the week.
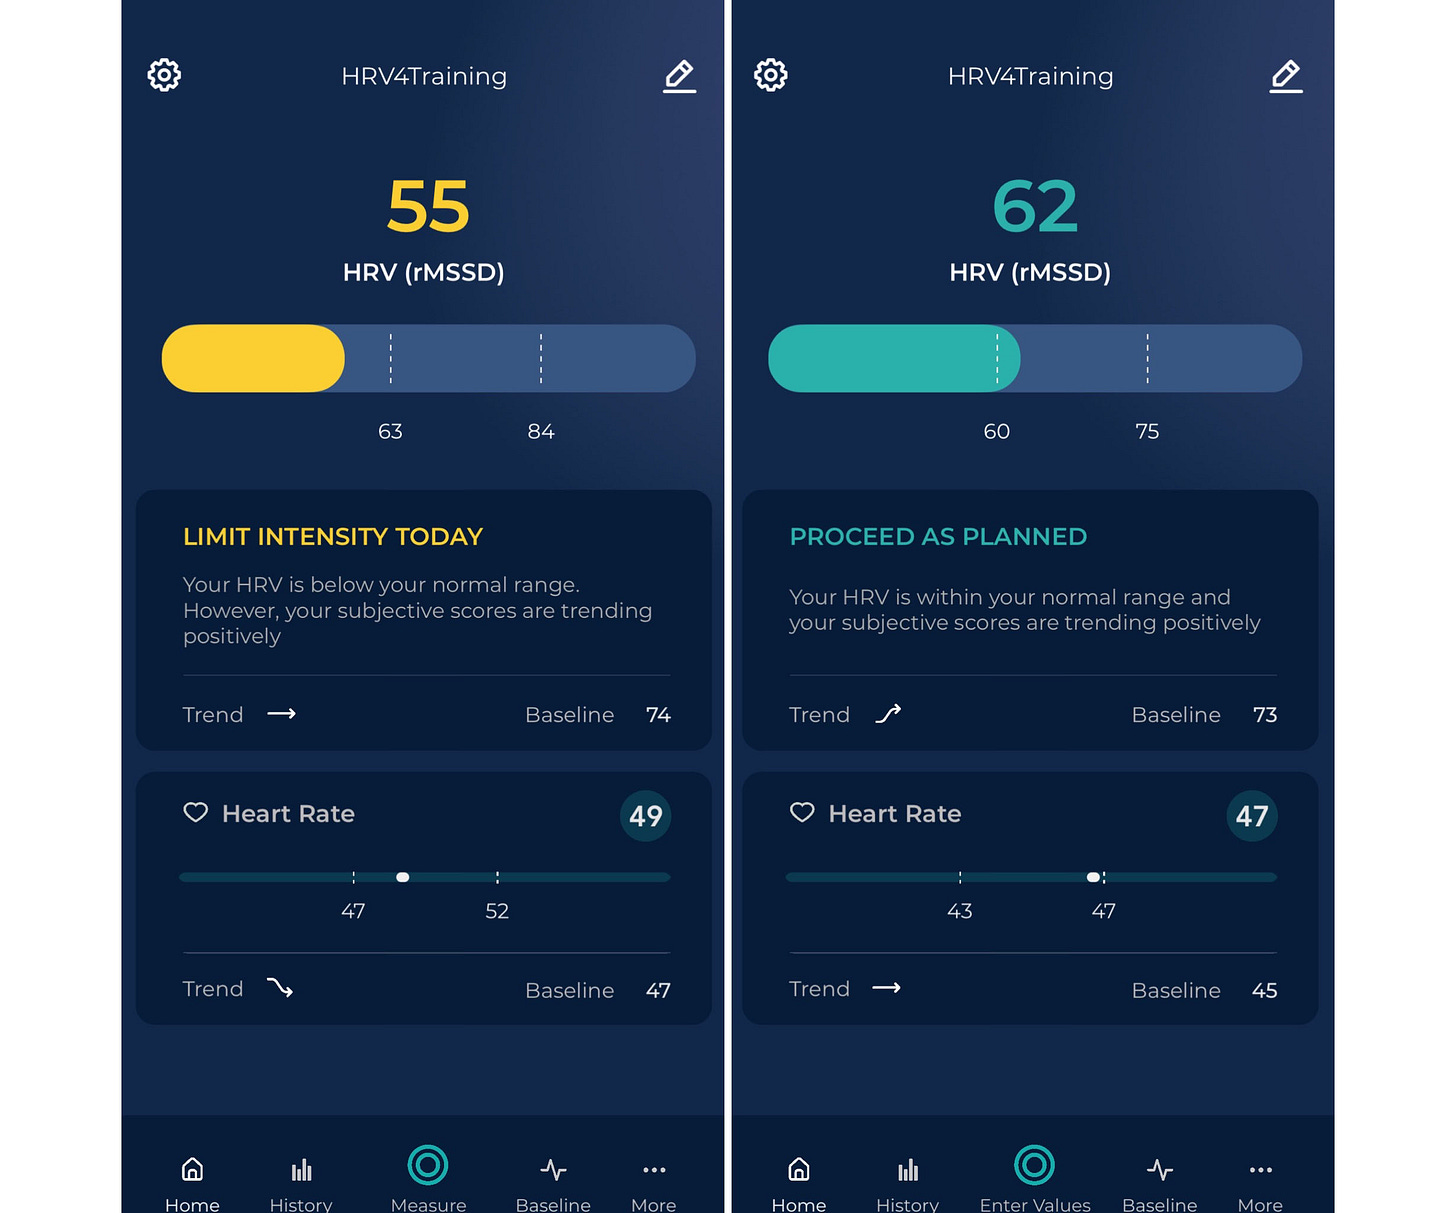
In the app, Pro brings the normal values view, which can help contextualizing longer-term changes, as well as rMSSD on the homepage, see an example below:

See you next week!
Marco holds a PhD cum laude in applied machine learning, a M.Sc. cum laude in computer science engineering, and a M.Sc. cum laude in human movement sciences and high-performance coaching.
He has published more than 50 papers and patents at the intersection between physiology, health, technology, and human performance.
He is co-founder of HRV4Training, advisor at Oura, guest lecturer at VU Amsterdam, and editor for IEEE Pervasive Computing Magazine. He loves running.
Social:


Interesting reading Mark, thanks for posting this!
Since I started with your HRV4 program just a few days ago, my long term historical record of HRV is what my Apple watch has been collecting since 3/22. Since then it's moved from 22 slowly up to 27 that October then dropped back to 20-23 for months until reaching 25 in 12/23.
I started back with road biking that summer, slowly at first as I grew used to biking the terrain around here and changing my gearing from 5x2 to 5x3 with a BIG in back going from 28 to 34, more appropriate for the hills here! That fall my HRV was back down to 22-25.
My 2024 biking didn't really kick off until late June owing to a couple of health issues that made for uncomfortable riding. Once those were behind me and my mileage increased, I can see a slow rise from 24 up to the high of 27 this month.
Once the '24 outdoor biking season ended with the return of colder weather around the middle of November I started seriously using a Wahoo trainer. That may account for the changes I see: 23 in October, 24 in November, 25 in December and now 27 for the first half of January.
From reading Phil Cavell's 'The Midlife Cyclist' I come away thinking higher HRV is better? So the slow increase I'm seeing is A Good Thing? If true, that's reassuring, particularly as I'm closing fast on my 76th birthday in a couple of months.
Looking forward to the return of outdoor biking weather here in SW Wisconsin and seeing where my HRV is headed as I progress.