Newsletter #22: your normal range
Defining your frame of reference is key to interpreting and making use of the data

One of the challenges when it comes to making sense of heart rate variability (HRV) data is that there is no universal frame of reference. After taking our first measurement, we haven’t really learned anything useful.
Naive tools add to the confusion by oversimplifying with the “higher is better” approach to HRV analysis, which makes little sense.
How should we interpret our data then?
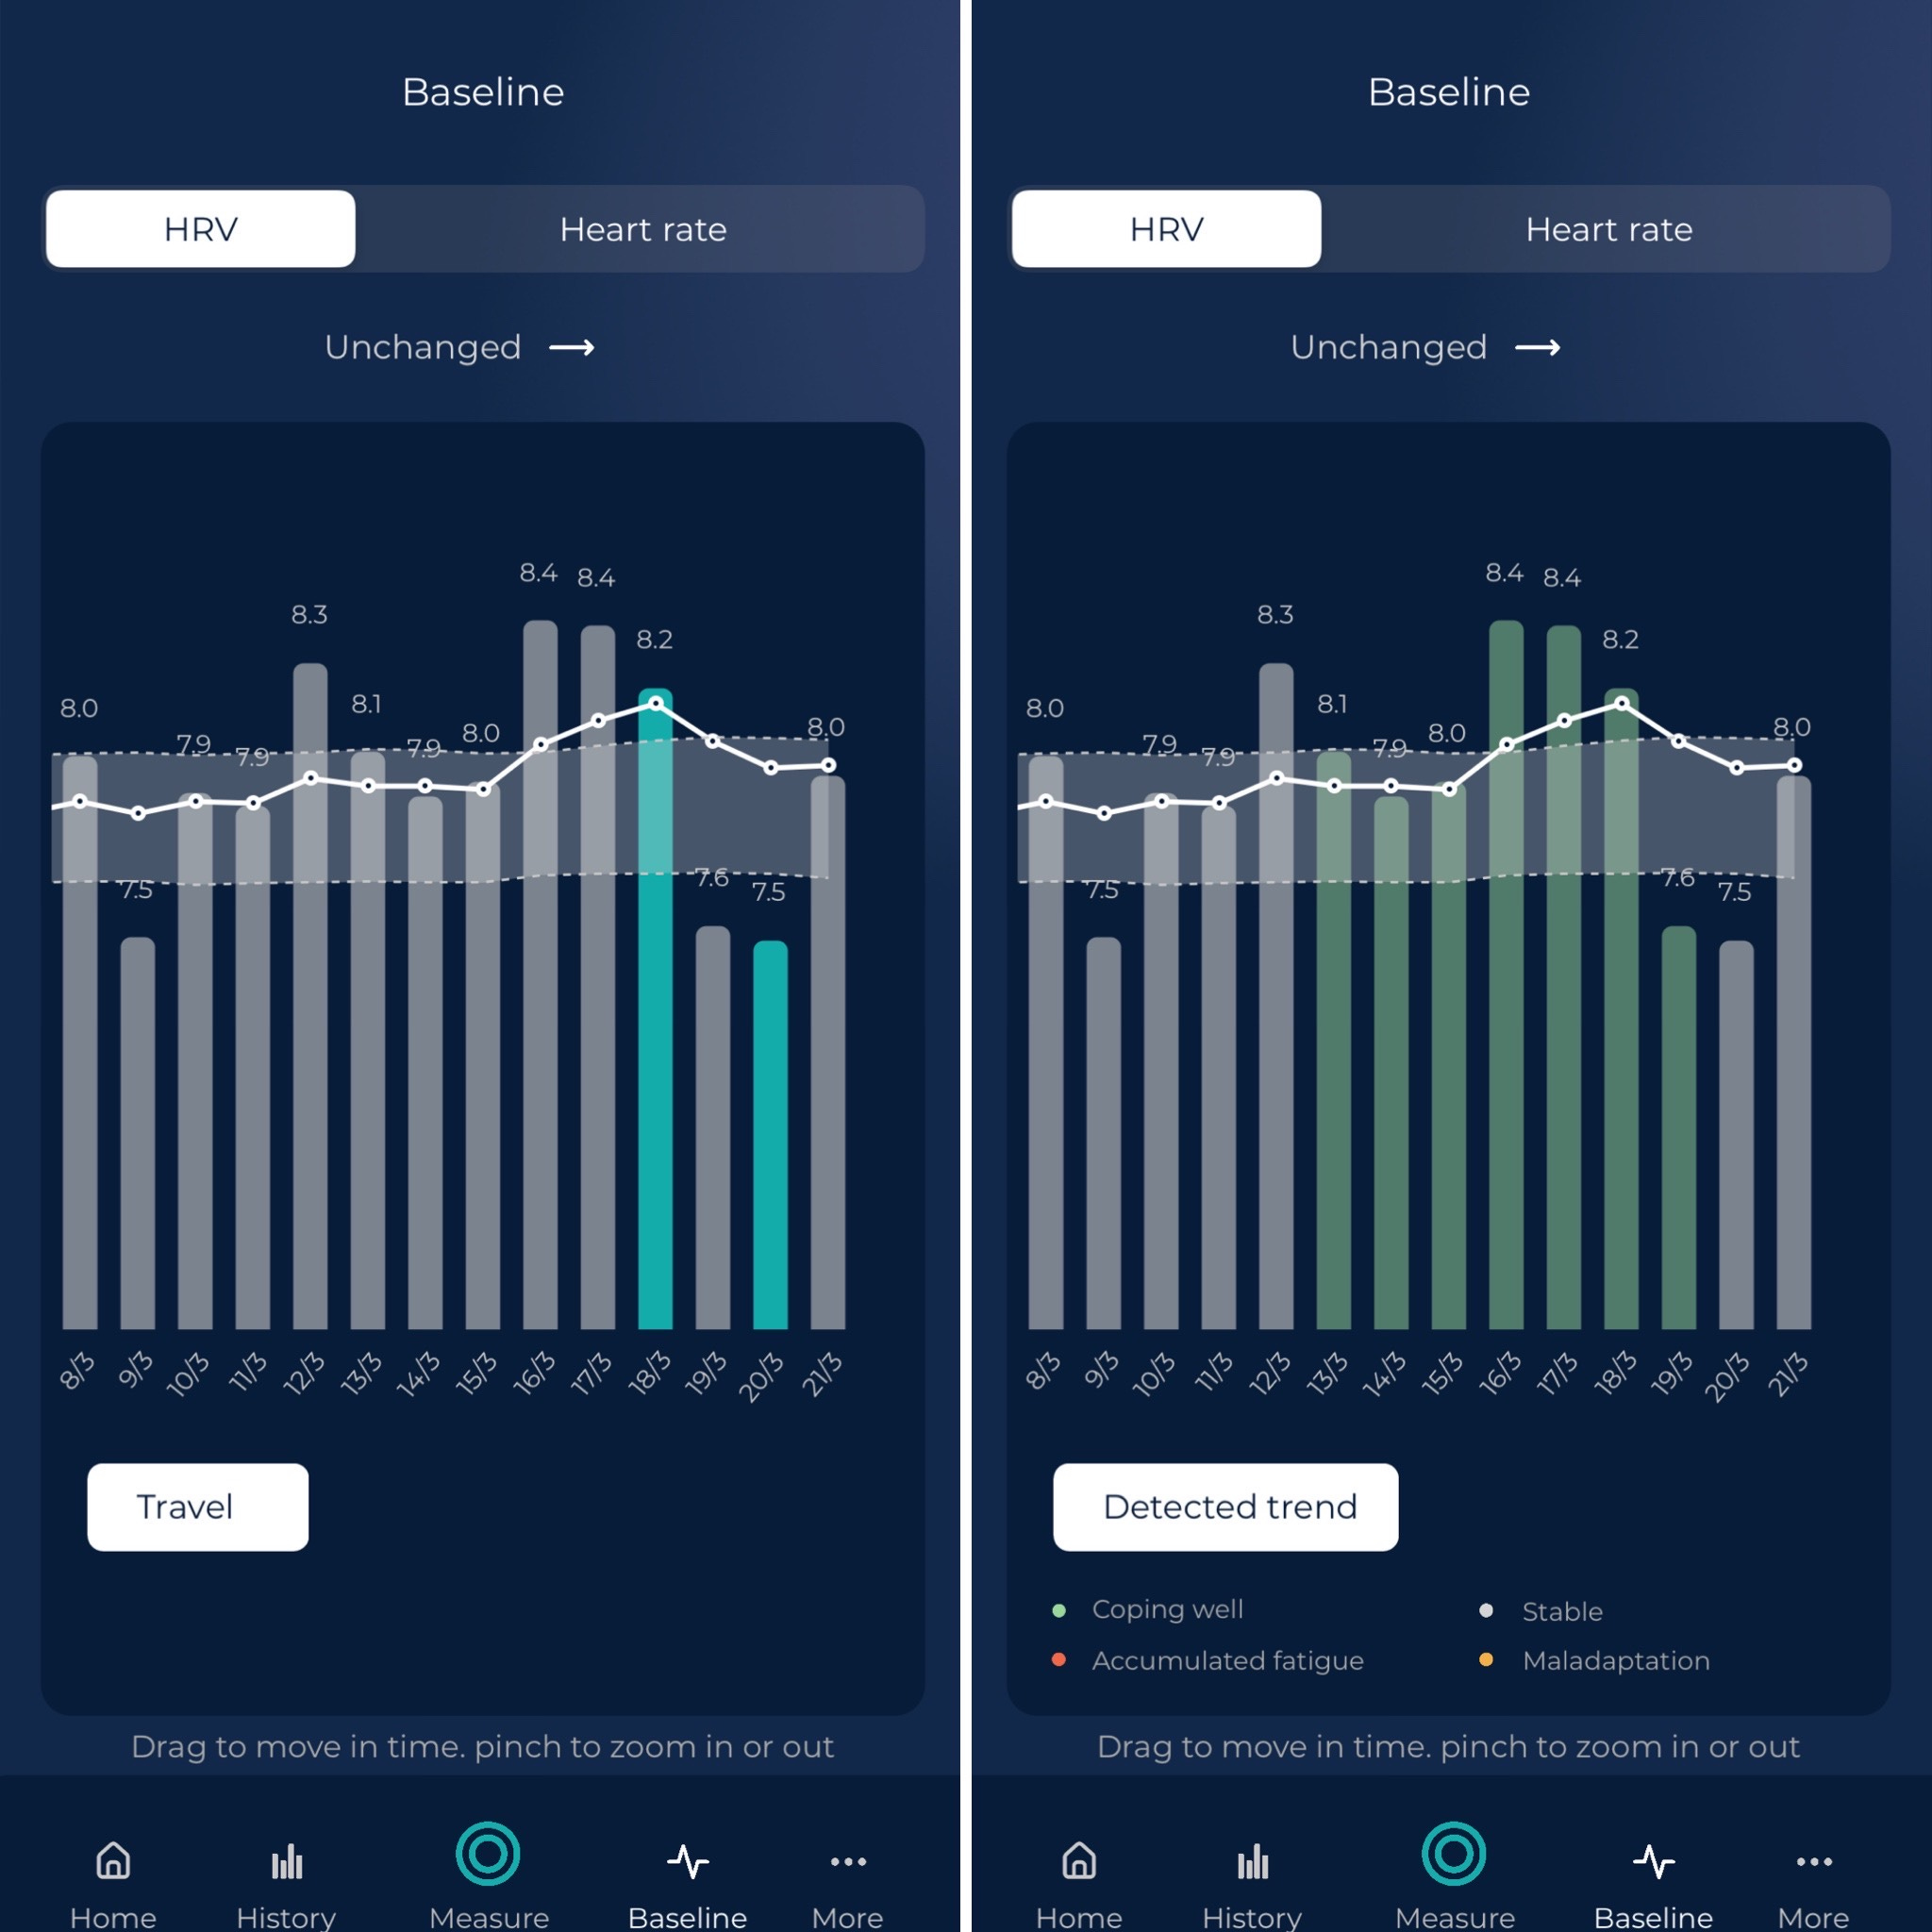
I often talk about your “normal range” as the only meaningful way to make use of HRV data. But what is this normal range and why is it important?
Learn more in my latest article, here.

Discount for Pro: 20% off
HRV4Training Pro is the ultimate platform to help you analyze and interpret your physiological data, for individuals and teams
You can findexamples and case studiesshowcasing how the platform can be used to better understand the effect of training and lifestyle stressors at this link
Try HRV4Training Pro for free atHRV4T.comor use promo codeSCIENCEfor20% off
In the app, Pro brings the normal values view, which can help contextualizing longer-term changes, as well as rMSSD on the homepage, see an example below:
see you next week!

Marco holds a PhD cum laude in applied machine learning, a M.Sc. cum laude in computer science engineering, and a M.Sc. cum laude in human movement sciences and high-performance coaching.
He has published more than 50 papers and patents at the intersection between physiology, health, technology, and human performance.
He is co-founder of HRV4Training, advisor at Oura, guest lecturer at VU Amsterdam, and editor for IEEE Pervasive Computing Magazine. He loves running.
Twitter: @altini_marco, Personal Substack.