Newsletter #19: metrics confusion
Newsletter #19: metrics confusion
do you know what you are doing?

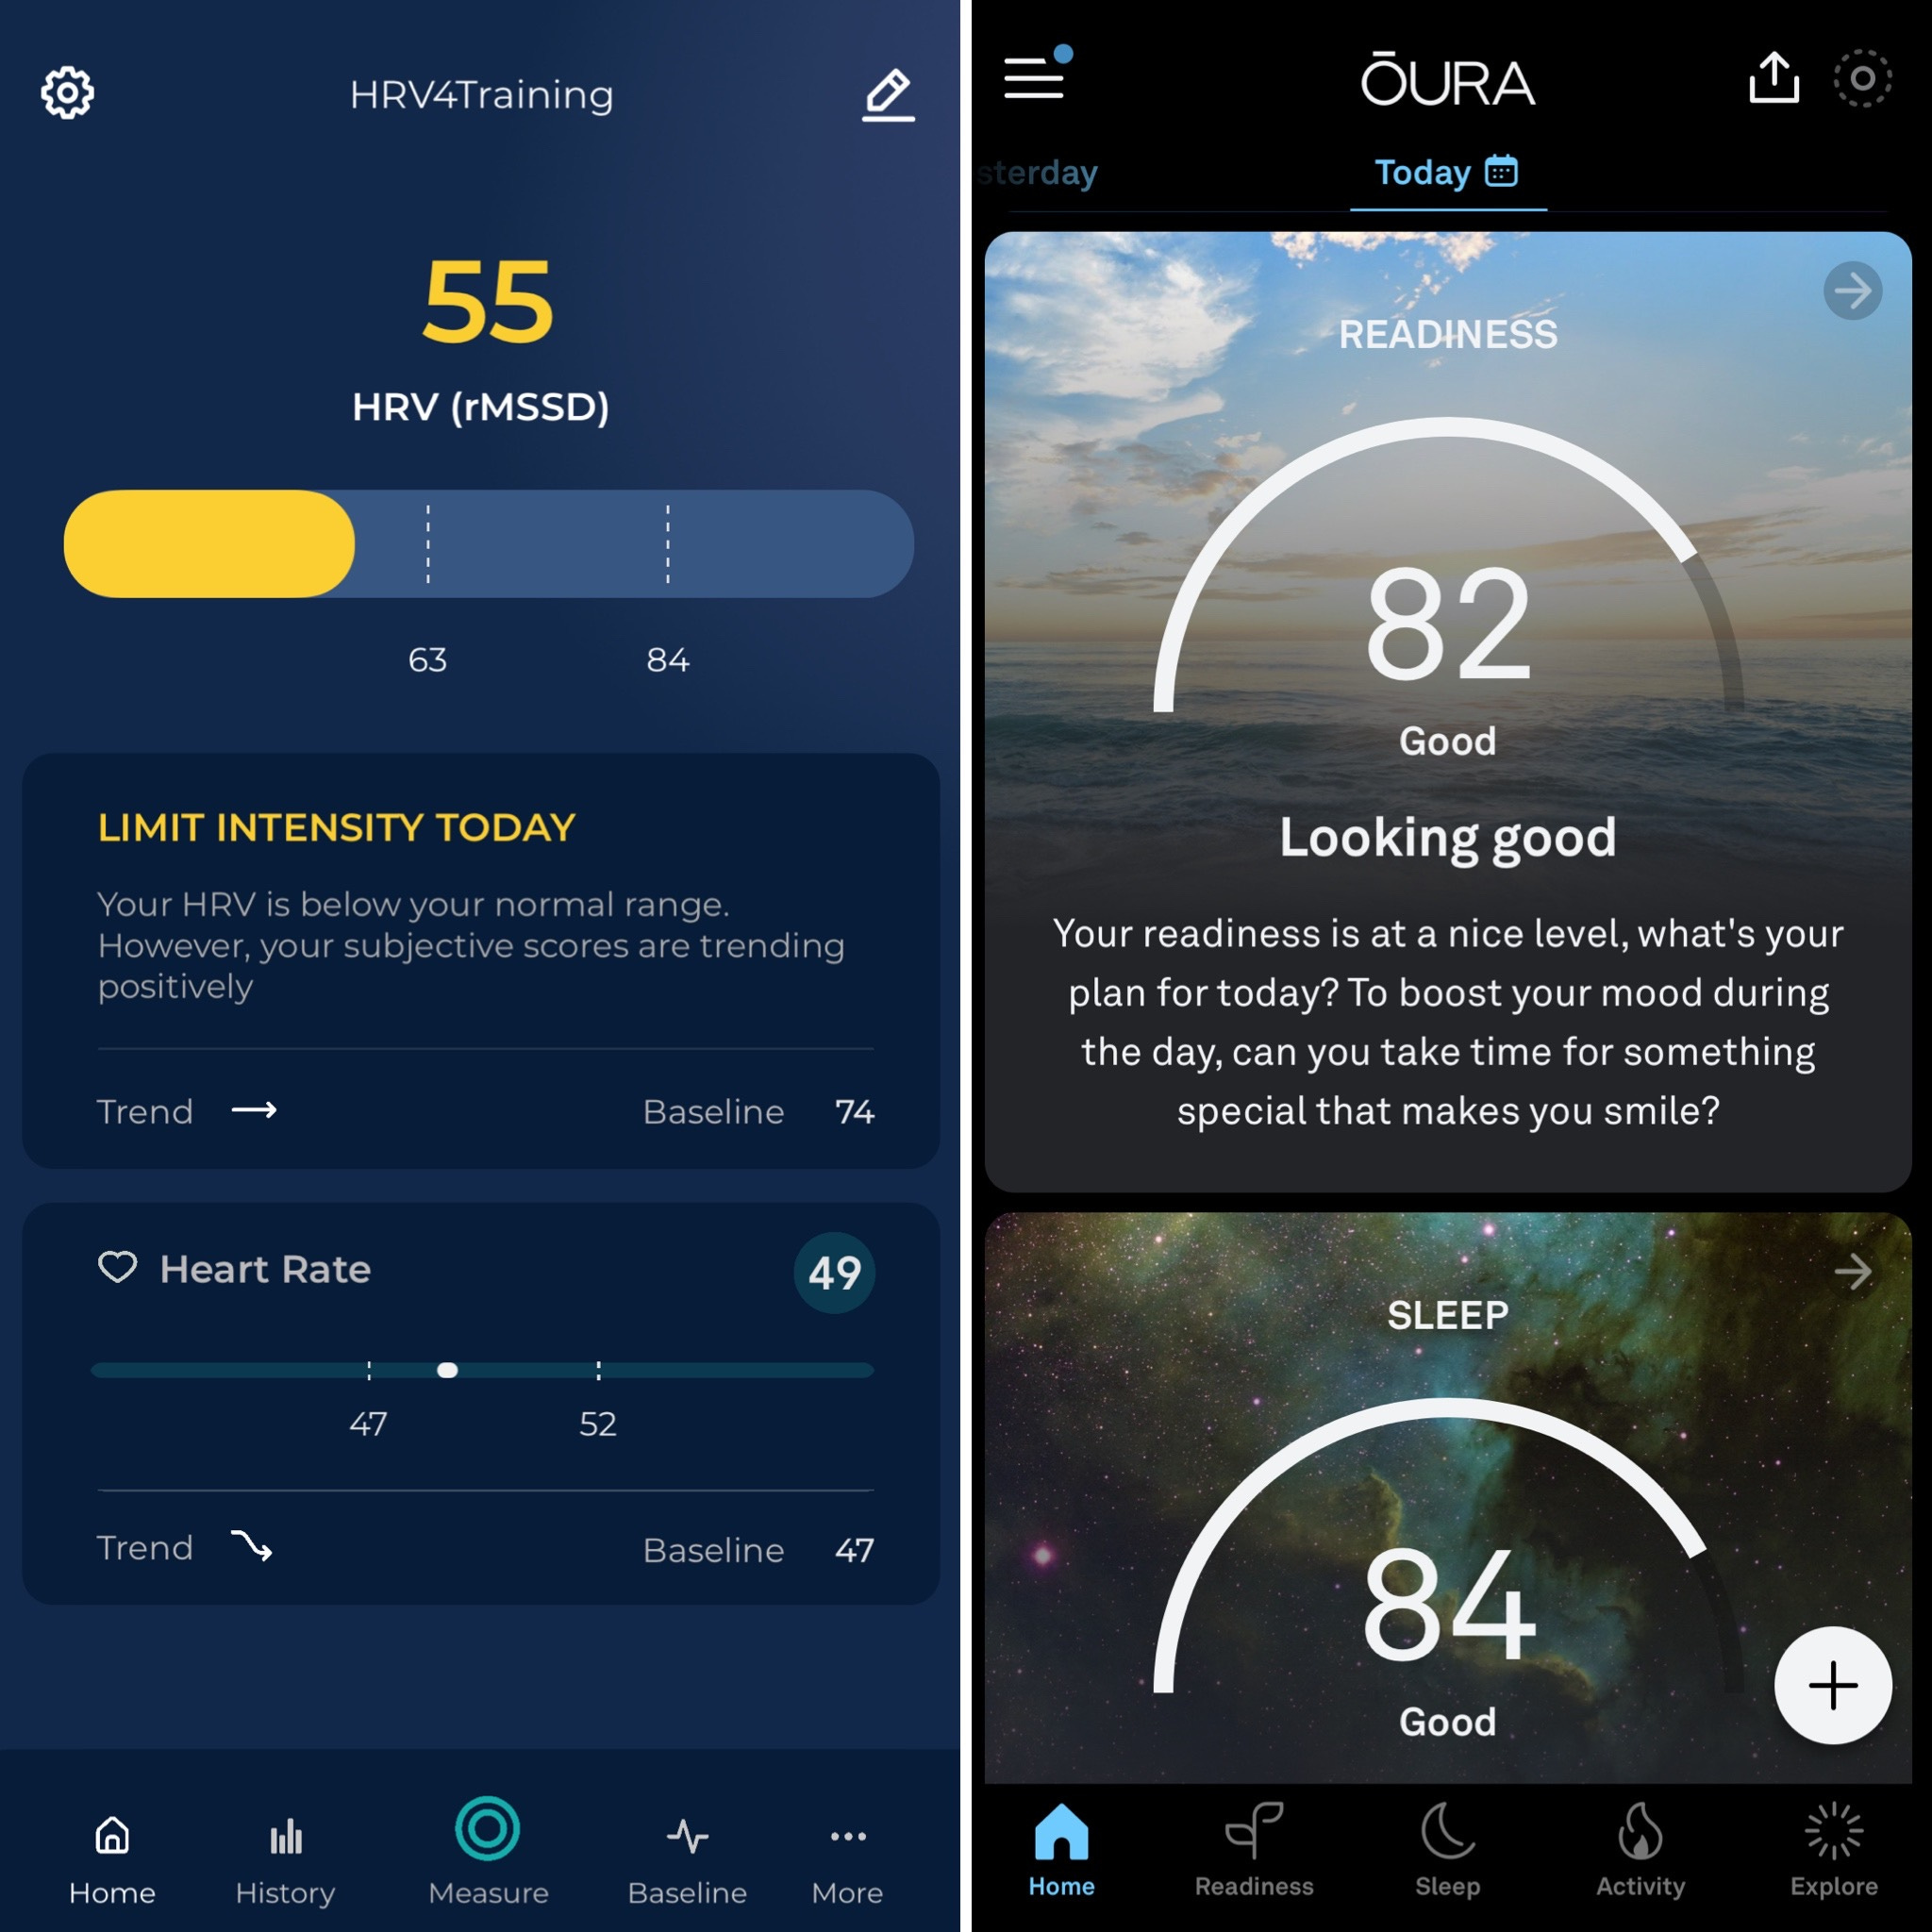
There are often reports of inconsistent outputs from different tools people use to track various metrics, e.g. apps or wearables for heart rate variability (HRV).
Often, it is not really an inconsistency but just a matter of understanding what is going on: e.g. when and how things are measured, and how the data is turned into messages or scores.
The more you understand the physiology and the technology, the better use you can make of it.
In my latest article, I want to show you a simple example of what I mean, and how what seems inconsistent output makes in fact a lot of sense when we understand what we are doing and how the tools work.
I hope you will find it useful.
Training talk
Here are two blogs I wrote recently that you might enjoy:
Discount for Pro: 20% off
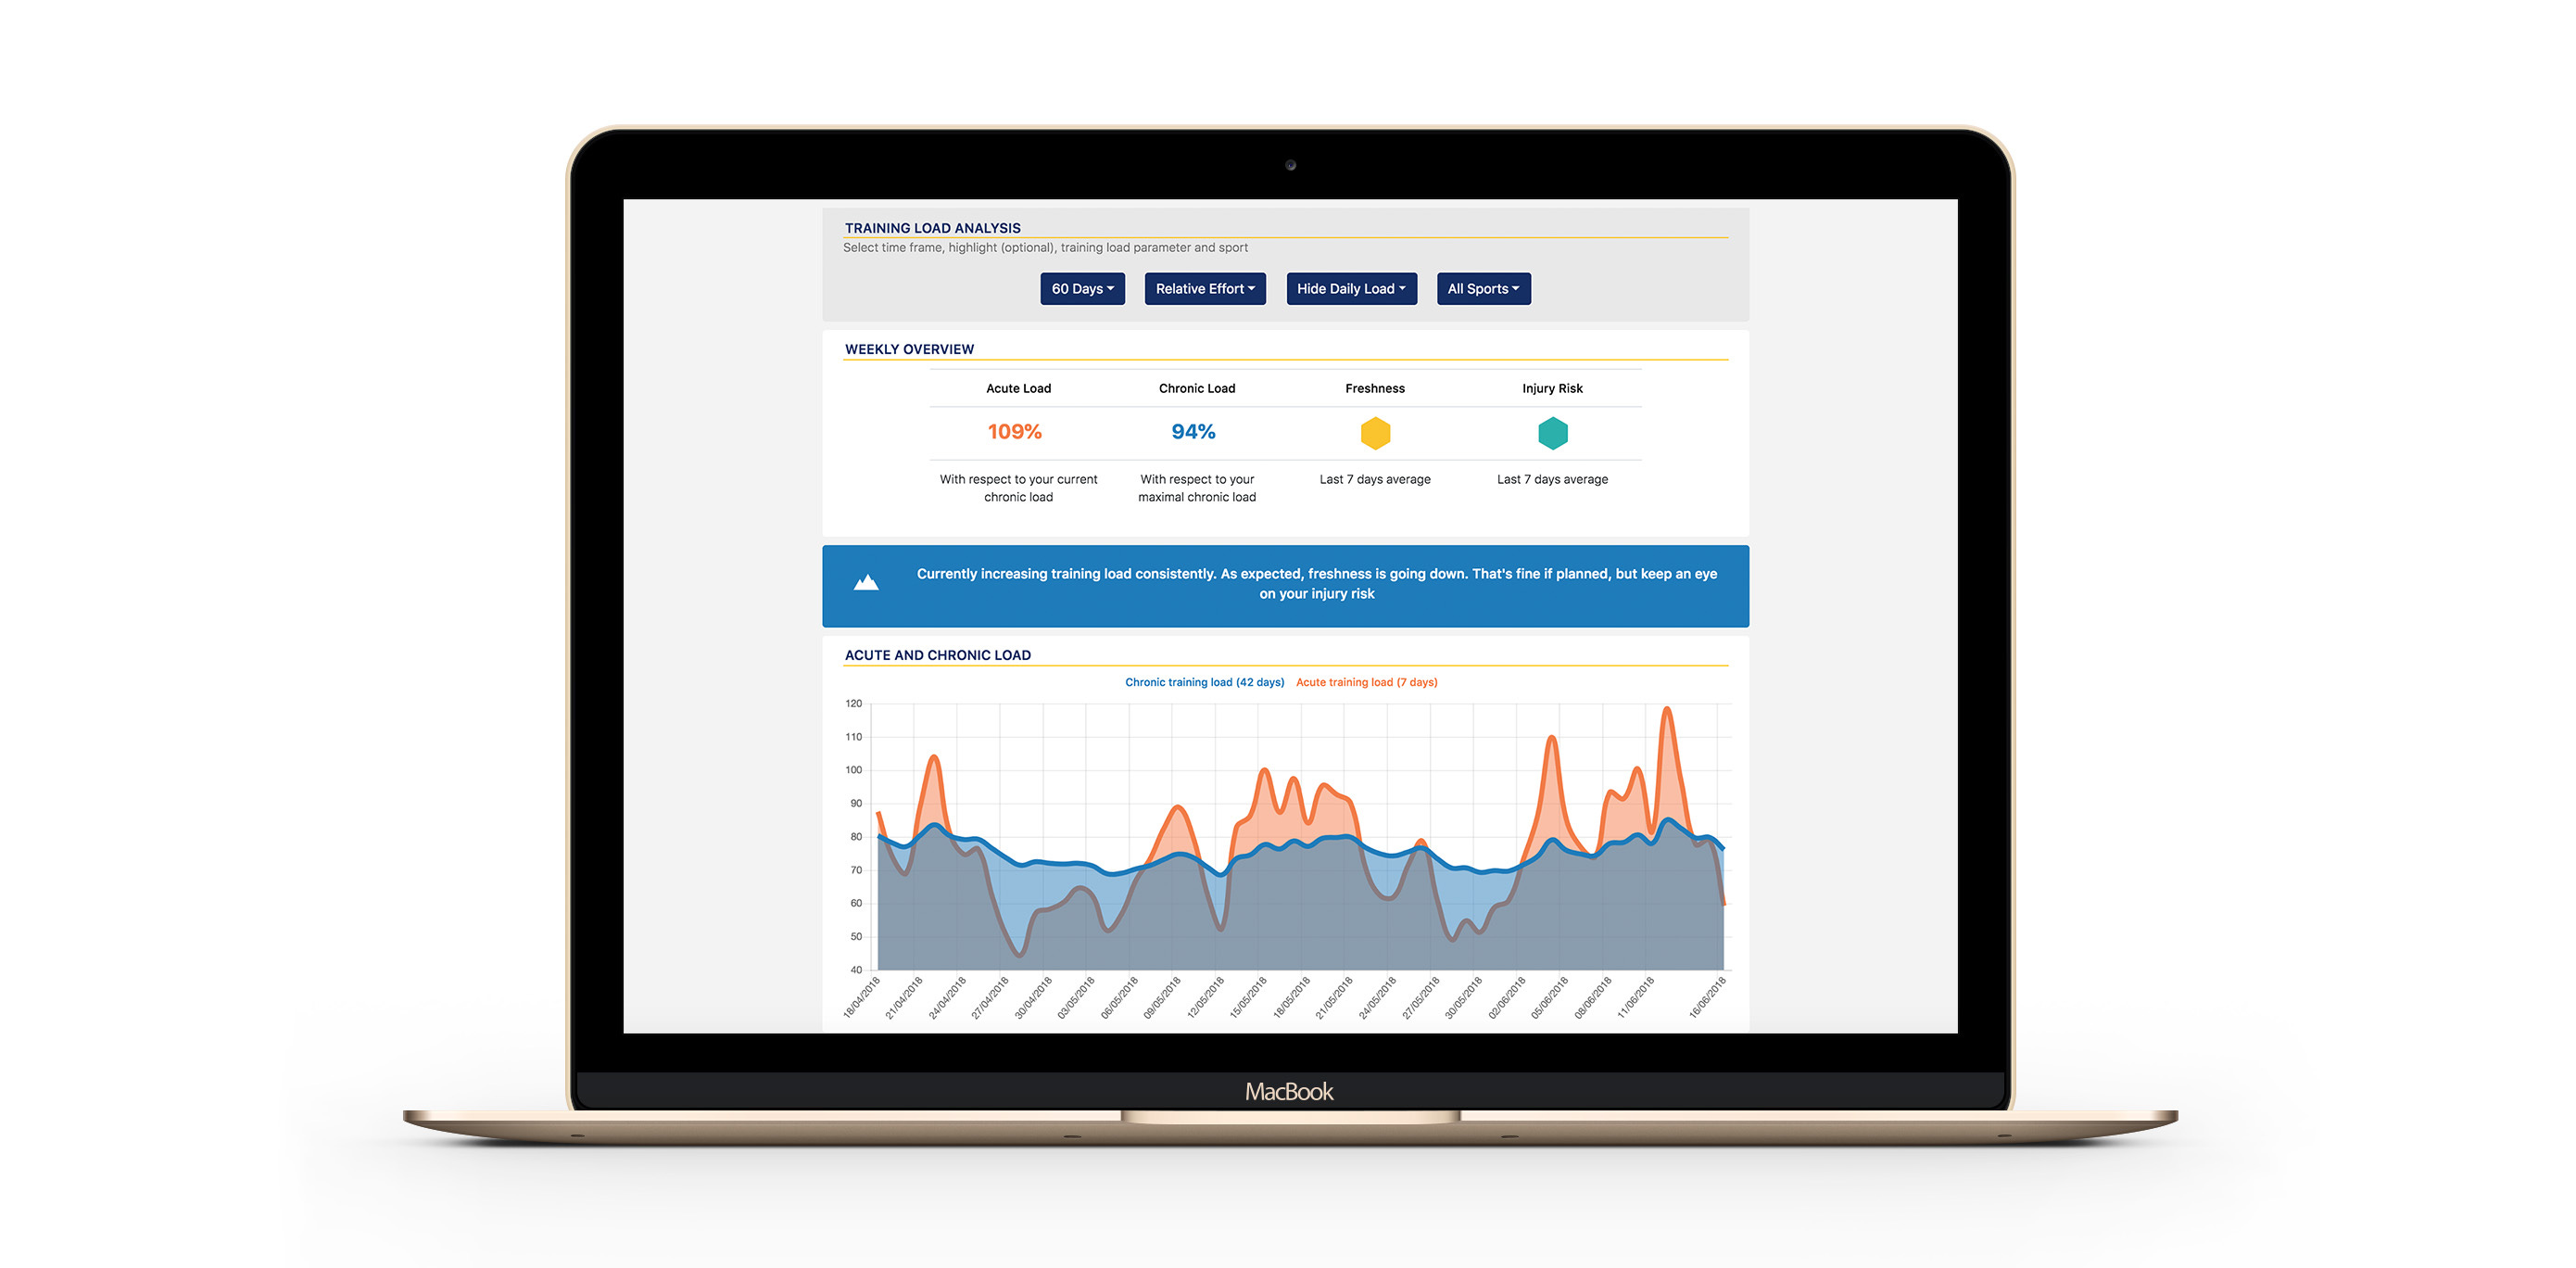
HRV4Training Pro is the ultimate platform to help you analyze and interpret your physiological data, for individuals and teams
You can findexamples and case studiesshowcasing how the platform can be used to better understand the effect of training and lifestyle stressors at this link
Try HRV4Training Pro for free atHRV4T.comor use promo codeSCIENCEfor20% off
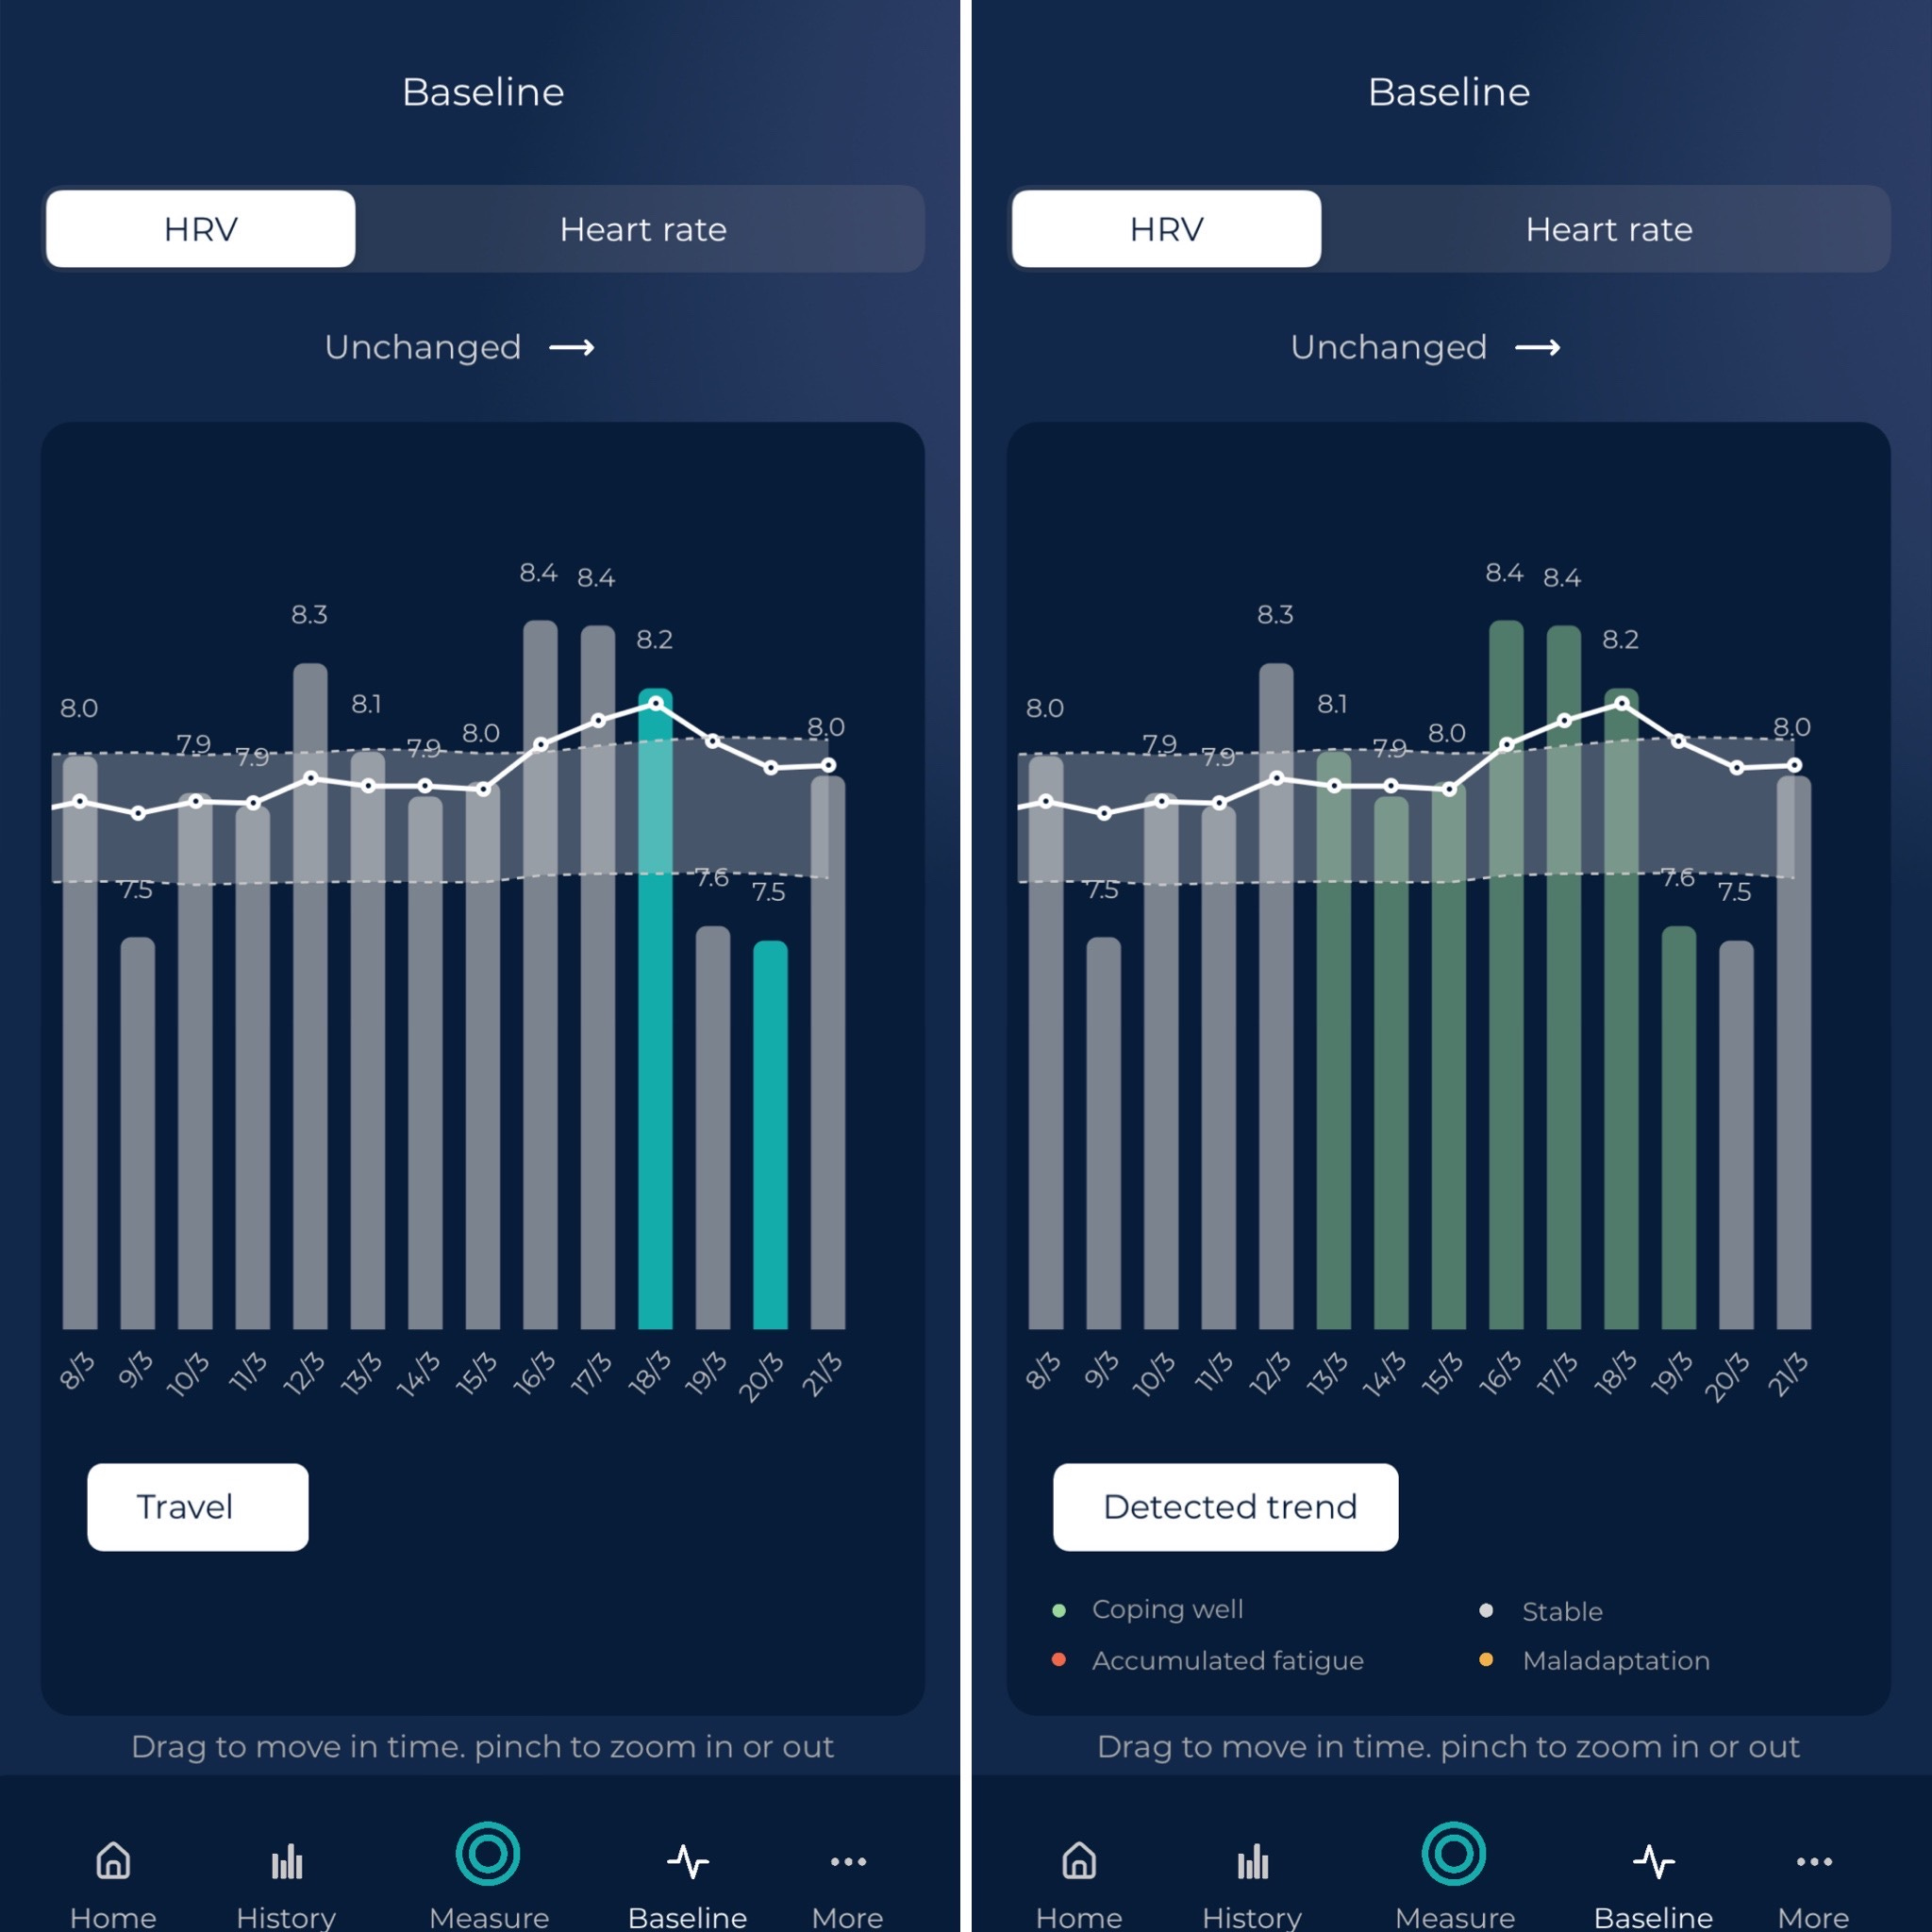
In the app, Pro brings the normal values view, which can help contextualizing longer-term changes, as well as rMSSD on the homepage, see an example below:
see you next week!

Marco holds a PhD cum laude in applied machine learning, a M.Sc. cum laude in computer science engineering, and a M.Sc. cum laude in human movement sciences and high-performance coaching.
He has published more than 50 papers and patents at the intersection between physiology, health, technology, and human performance.
He is co-founder of HRV4Training, advisor at Oura, guest lecturer at VU Amsterdam, and editor for IEEE Pervasive Computing Magazine. He loves running.
Twitter: @altini_marco, Personal Substack.